At a glance
- From 2011 to 2021, the estimated resident population of First Nations peoples in Queensland increased 25.3% from 218,047 to 273,119.
- For First Nations peoples in Queensland, the most significant change in age structure from 2011 to 2021 occurred in the 65 years and older age group, which more than doubled in this period (from 7,002 in 2011 to 14,275 by 2021).
- In Queensland in 2022, 61,377 babies were born of which 6,351 (10.3%) were First Nations babies. In Queensland in 2022, 60,450 women gave birth, of which 4,755 (7.9%) identified as First Nations women.
This section was prepared by the First Nations Health Office with technical support by the area that prepares The Health of Queenslanders: Report of the Chief Health Officer Queensland. Data sources may differ from those used in the wider report and results may not be comparable. Please see technical documentation for additional information.
Population change for First Nations peoples
The estimated resident population (ERP or estimated population) for First Nations peoples is derived from census counts which have been adjusted for under enumeration (people that were not counted on Census night) and under identification (First Nations peoples not identified as such on Census forms).
- From 2011 to the most recent census year, 2021, the estimated population of First Nations peoples in Queensland increased 25.3% from 218,047 to 273,119 and 22.0% in Australia, from 806,090 to 983,709 (Figure 1).
- From 2021 to 2031, the Queensland First Nations estimated population is projected to increase by 25.1% from 273,119 to 341,705. This is greater than the rate of increase projected for the Australian First Nations population, which is projected to grow from 983,709 to 1,179,088, an increase of 19.9% (Figure 1).
Figure 1: Population change for First Nations people
Change in age distribution of First Nations peoples
Examining age structure changes is vital for planning healthcare and addressing age-specific health needs.
For First Nations people in Queensland, the most significant change in age structure from 2011 to 2021 occurred in the 65 years and older age group, which more than doubled in this period (from 7,002 in 2011 to 14,275 by 2021). Over the same time period, the 45 to 64 age group grew by 43.5% from 32,456 to 46,561, while younger age groups saw more modest changes with (Figure 2):
- 0 to 14 year olds increasing by 14.1% from 81,445 to 92,942
- 15 to 29 year olds increasing 30.6% from 55,547 to 72,517
- 30 to 44 year olds increasing by 12.6% from 41,597 to 46,824.1
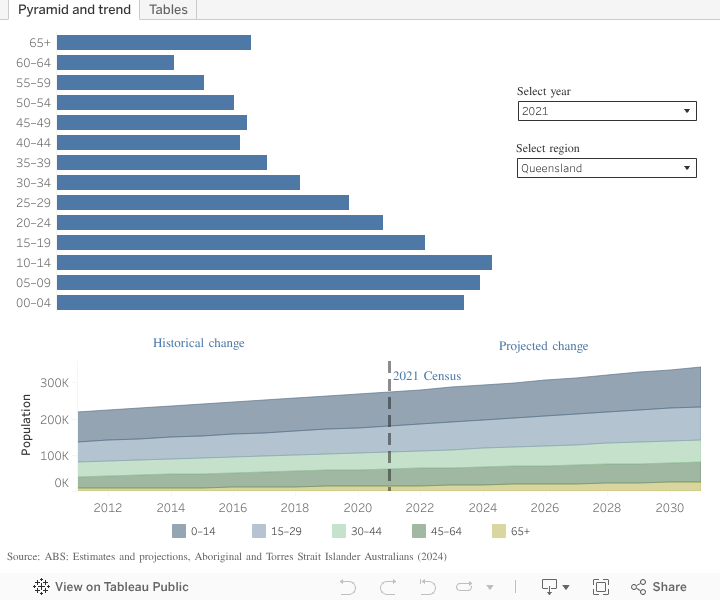
Projections from 2021 to 2031 suggest continued strong growth for all age groups, with the strongest proportional growth occurring in the 65 years and older age group (74.2% growth, from 14,275 to 24,862), and more moderate growth forecast for the mid-adult and younger age groups (Figure 2). Queensland’s projected patterns of demographic ageing and more moderate growth in younger groups aligns closely with those at the national level (Figure 2).
Figure 2: Demographic change for First Nations people
If dashboard does not load, view the dashboard in Tableau.
Determinants - Protective Factors
Healthy start to life
In 2022, 61,377 babies were born in Queensland of which 6,351 (10.3%) were First Nations babies. In the same year, 60,450 Queensland women gave birth, of which 4,755 (7.9%) identified as First Nations women.2
In 2022, among First Nations women residing in Queensland:3
- 90.6% of First Nations mothers attended five or more antenatal visits, compared to 96.6% for other Queensland mothers
- 40.5% of First Nations mothers reported that they had smoked during pregnancy compared to 8.6% for other Queensland mothers
- 10.0% of live born singleton babies born to First Nations mothers weighed less than 2,500g (low birth weight), and 10.4% were born pre-term (born at less than 37 weeks gestation), compared to 4.8% and 6.1% for other Queensland mothers, respectively.
Additional information
Data and statistics
The Queensland Government Statistician’s Office publishes Queensland regional profiles that are informative statistical reports on a range of Queensland communities.
Section technical notes
The propensity to identify as Aboriginal and Torres Strait Islander has had an impact on population estimates and is discussed at Understanding change in counts of Aboriginal and Torres Strait Islander Australians: Census4 on the Australian Bureau of Statistics website.
In the Australian Institute of Health and Welfare Australia’s mothers and babies report, the data is for all mothers who gave birth in Queensland and babies are those born to the mothers that birthed in Queensland.
Figures on this page are interactive
To learn more about how to navigate interactive figures, dashboards, and visualisations see About this Report.
References
- Australian Bureau of Statistics. 2024. Estimates and projections, Aboriginal and Torres Strait Islander Australians, 2021 to 2031, ABS, Estimates and Projections, Aboriginal and Torres Strait Islander Australians, 2011 to 2031 | Australian Bureau of Statistics, accessed 10 February 2025.
- Australian Institute of Health and Welfare Australia’s mothers and babies report (National Perinatal Data Collection), https://www.aihw.gov.au/reports/mothers-babies/australias-mothers-babies, accessed 10 February 2025.
- Statistical Services Branch. 2024. Queensland Perinatal Data Collection, Queensland Health.
- Australian Bureau of Statistics. 2021. Understanding change in counts of Aboriginal and Torres Strait Islander Australians: Census, ABS website, https://www.abs.gov.au/statistics/people/aboriginal-and-torres-strait-islander-peoples/understanding-change-counts-aboriginal-and-torres-strait-islander-australians-census/latest-release, accessed 27 November 2024.