At a glance
- Estimates of the proportion of people living with a chronic disease range from about a third to about half depending upon the subset of conditions considered. Similarly, estimates of the proportion living with more than one condition range from about 10% to 20%.
- In 2022–23 hospitalisation rates were 2.7 times higher (COPD) and 2.6 times higher (diabetes) in remote and very remote areas, and 2.8 times higher (COPD) and 2.4 times higher (diabetes) in the most disadvantaged areas.
- Hospitalisations for the combined group of seven chronic diseases decreased by 18.0% from 2015–16 to 2022–23. Mortality for these conditions decreased by 44.5% from 2002 to 2022.
Introduction
Chronic diseases, also known as non-communicable diseases (NDC), can be defined as diseases that have lasted, or are expected to last, more than six months. The World Health Organization (WHO) estimates that approximately 41 million people die from chronic diseases each year globally, which is equivalent to 74% of all deaths.1 Chronic diseases are often associated with older age groups, but are also strongly related to modifiable risk factors such as tobacco smoking, risky alcohol consumption, unhealthy diet and physical inactivity.2
In Australia in 2024, over half of the disease burden (64.0%) was from top 5 disease groups contributing to the burden, which mainly consists of chronic diseases.3 As Australia’s population ages, the number of people with chronic diseases, and the associated health burden, will increase.
Chronic disease burden
For the subset of chronic conditions included in this section, the number and age-standardised rate (ASR also referred to as a standardised rate) of years of healthy life lost in 2024 were:
- Coronary heart disease (CHD): 317,105 years (standardised rate 8.9 per 1,000 persons)
- Chronic obstructive pulmonary disease (COPD): 211,719 years (standardised rate 5.7 per 1,000 persons)
- Asthma: 143,782 years (standardised rate 5.3 per 1,000 persons)
- Type 2 diabetes: 127,592 years (standardised rate 3.7 per 1,000 persons)
- Stroke: 125,141 years (standardised rate 3.4 per 1,000 persons)
- Dementia: 262,052 years (standardised rate 6.5 per 1,000 persons).3
Corresponding health expenditure information for 2022–23 was $3.800 billion (CHD), $1.656 billion (COPD), $1.192 billion (asthma), $2.895 billion (type 2 diabetes), $1.970 billion (stroke) and $0.850 billion (dementia).4
A recent study in the United Kingdom estimated the total cost to society per case for selected chronic diseases in 2018 at £7,857 (CHD), £17,145 (dementia) and £16,224 (stroke).5 The study also highlighted that depending on the disease, the sector of society that bears the cost of the disease varies. For example, while health care costs were the highest contributor for CHD (52.4% of the total cost), social care cost were the largest contributor for dementia (54.7% of the total cost). Similarly, the proportion of total costs due to productivity losses was 23.7% for CHD but 1.2% for dementia. The proportion of cost for informal care (opportunity cost for unpaid care), however, was 5.9% and 30.9% for CHD and dementia, respectively. Although these numbers may not directly translate to Australian settings, they provide insights into the different areas of the society which would be economically more impacted from the diseases.
Selected health conditions
This section focuses on selected health conditions that cause high levels of morbidity and mortality that are also preventable. It includes information from a large, regularly administered, national survey, hospitalisation data and mortality. Because much of the treatment and management of these conditions occurs in other settings, hospitalisations will under-estimate the impacts of these conditions.
Self-reported chronic conditions
Chronic conditions are managed in a variety of settings including GP practices, allied health centres, hospitals and other outpatient services, and through self-management. Because of this, administrative health records, such as hospitalisation records, may underestimate the prevalence of these conditions. Conversely, some chronic conditions that must be treated in hospital, such as some cancer treatments, or require multiple courses of treatment, may overestimate prevalence of some conditions.
Population surveys provide important information to help understand how many people are living with chronic conditions. However, because survey participants self-report whether their doctor has told them that they have a chronic condition, survey results may also over or under report the number of people living with these conditions. Using multiple information sources, therefore, provides a more complete picture of the health impact.
Selected chronic conditions
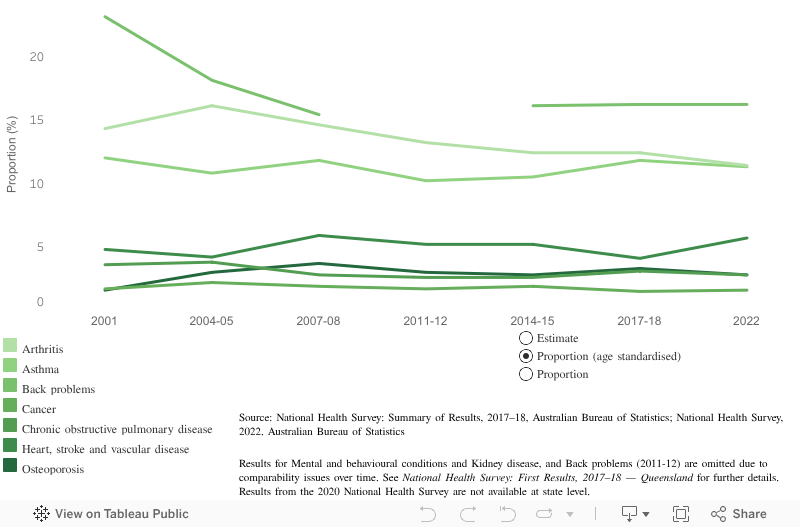
Chronic conditions are a significant cause of both morbidity and mortality and in 2020 nearly 90% of all deaths were associated with one of those ten selected chronic conditions nationally.6 Since 2001, the National Health Survey (NHS) has included a subset of chronic conditions with the most recent NHS data collected in 2022.
Based on the subset of conditions included in the NHS, over half (standardised proportion 51.7%) of the Queensland population were living with a chronic condition in 2022. This included:
- almost 1-in-3 Queenslanders were living with one chronic condition (standardised proportion 30.3%)
- another 1-in-5 were living with more than one of these conditions (standardised proportion 21.4%).7
Figure 1: Queensland trends in selected chronic conditions
If dashboard does not load, view the dashboard in Tableau
Selected long term health conditions
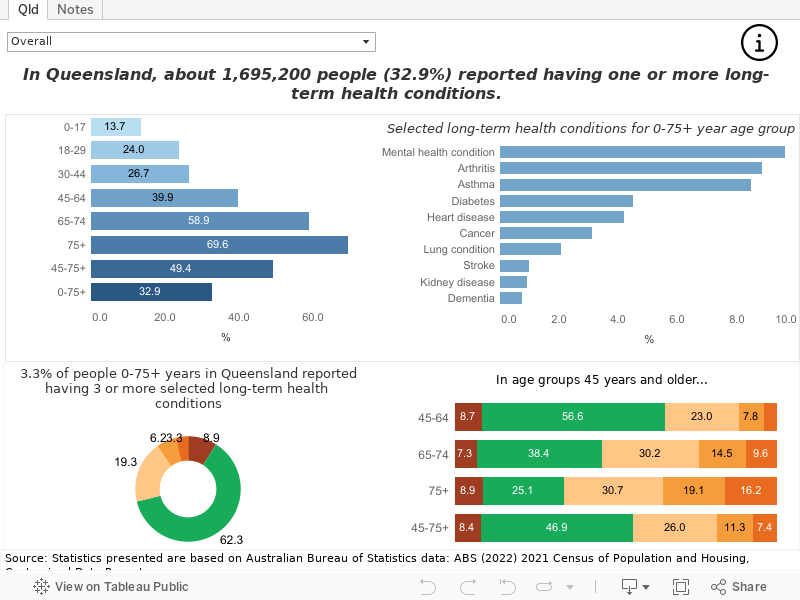
The 2021 Census included questions about long term health conditions for the first time.8 The subset of conditions on the Census differed from those used on the NHS and results are not comparable. Because of the consistent collection over time, the NHS remains the recommended primary source for long term condition prevalence. However, because census data are available for almost all Australian residents, the 2021 Census provides important regional insights.9
According to the 2021 Census, 32.9% of Queenslanders reported living with at least one long term health condition. For those 75 years and older, this increased to 69.6%. In Queensland, about (Figure 2):
- 9.6% live with a mental health condition (including depression or anxiety)—13.0% for adults 18 to 29 years
- 8.8% live with arthritis
- 8.5% live with asthma
- 4.5% live with diabetes (excluding gestational diabetes).
People are also living with more than one health condition with:
- 7.4% of people 45 years and older and 16.2% of people 75 years and older reported living with three or more selected long term health conditions
- 17.1% of people who reported living with a mental health condition (including depression or anxiety) also have two or more other selected long term health conditions. This increased to 59.7% for people 75 years and older
- 30.4% of people who reported living with cancer also have two or more other selected long term health conditions.
Figure 2: Selected long term health conditions, Queensland, 2021
If dashboard does not load, view the dashboard in Tableau
Please refer to technical note below and on the Notes tab in Figure 2 for further information about these results.
Hospitalisations
Hospital episodes of care reflect the impact of chronic diseases to one component of the health care sector. While hospitalisations cannot accurately estimate the number of people with chronic conditions, they can identify subgroups that are more impacted by chronic conditions. Because many chronic conditions are caused or made worse by modifiable risk factors, improving lifestyles is important to the sustainability of the healthcare sector.
In addition to the specific conditions in this section, a subset of seven lifestyle-related conditions have been combined to assess the impact of conditions with the highest health burden. This subset includes CHD, stroke, lung cancer, colorectal cancer, breast cancer, COPD and diabetes. More detailed results for lifestyle-related cancers are in the Cancer section of this report.
The National Preventive Health Strategy 2021–2030 recommends a more coordinated and evidence-driven approach for long term, sustainable improvements to the health and wellbeing of all Australians.
Demographic differences
Hospitalisation rates for chronic conditions often vary by age. In Queensland in 2022–23:10
- Males had higher standardised hospitalisation rates than females for CHD (2.3 times higher; 7.1 compared to 3.1 per 1,000 for males and females, respectively), diabetes (63.8% higher), stroke (42.7% higher) and the seven lifestyle-related chronic conditions (37.2% higher).
- Children 0 to 14 years had higher age-specific rates (ASpR) for asthma than older age groups (Figure 3).
Sex differences changed with age for some health conditions. For example, the diabetes hospitalisation rate was 2.3 times higher in males 65 years and older compared to females of the same age (9.7 compared to 4.3 per 1,000 persons, respectively). This was also evident in asthma and coronary heart disease.
Rate ratios in this section were calculated with higher precision than the presented numbers. See Technical notes.
Figure 3: Queensland hospitalisations for selected chronic conditions, 2022–23
Remoteness and sociodemographic differences
Regions within Queensland can be classified by remoteness11 and the area-based index of relative socioeconomic advantage and disadvantage.12 Variability in hospitalisation rates by these measures may indicate inequity in health services or modifiable risk factors that contribute to chronic disease.
In 2022–23, standardised hospitalisation rates in remote areas compared to major cities were (Figure 4):
- 53.3% higher for asthma (2.0 per 1,000 persons for remote areas compared to 1.3 per 1,000 persons for major cities)
- 2.7 times higher for COPD
- 2.6 times higher for diabetes
- 84.7% higher for CHD
- 73.9% higher for the seven lifestyle-related chronic conditions.
In 2022–23, standardised hospitalisation rates in the most disadvantaged areas compared to the most advantaged areas were:
- 65.9% higher for asthma (1.9 per 1,000 persons for the most disadvantaged compared to 1.1 per 1,000 persons for the most advantaged)
- 2.8 times higher for COPD
- 2.4 times higher for diabetes
- 48.0% higher for CHD
- 60.5% higher for the seven lifestyle-related chronic conditions.
Figure 4: Queensland hospitalisations for selected chronic conditions by remoteness and socioeconomic status, 2022–23
Trends
Health conditions leading to admitted hospital patient episodes are assigned according to the Australian Coding Standards. Changes in these practices may result in large changes at a single time point and thus impact interpretation of changes over time. For example, although the number of people living with diabetes in Australia has increased during the last two decades,13 hospitalisation rates for diabetes have fluctuated over the years. This is largely due to coding changes over the last decade, especially those that came into effect in July 2010 (7th edition).14,15 Similarly, coding changes for rehabilitation episodes of care from July 2015 have impacted the trend for hospitalisations from other chronic conditions, such as stroke and dementia.3,16 Trend analysis has therefore been limited to episodes after these coding changes and, for consistency of interpretation, has been applied to all conditions.
High level trends are reported as the average annual percentage change (APC) on Figure 5 and over the relevant time period in text. It is acknowledged that these results may differ from more detailed trend analyses that include factors explaining the variability over time. In this report, the intent is to demonstrate differences in trends across health conditions using a consistent approach. To control for the ageing of the population, age standardised rates were used.
Some health conditions varied over time with COVID-19 introducing additional variability or disrupting earlier trends and should therefore be interpreted with caution. See Section Technical notes for more information.
From 2015–16 to 2022–23, trends in standardised hospitalisation rates per 1,000 for (Figure 5):
- Asthma declined by 34.7% over the period with similar decreases in males and females.
- COPD declined by 32.2% over the period with similar decreases in males and females although trends should be interpreted with caution due to COVID-19 disruptions.
- Diabetes in males increased by 12.5% over the period.
- CHD decreased by 25.9% over the entire period with similar declines in males and females.
- Dementia in males increased by 12.5% over the period.
- Lifestyle-related chronic conditions declined by 18.0% over the period driven by decreasing CHD hospitalisation rates. Similar declines were observed in males and females.
Figure 5: Trends in Queensland hospitalisations for selected chronic conditions
Mortality
Demographic differences
In 2022, mortality rates were higher in males than females for COPD (39.8% higher; 25.7 per 1,000 for males compared to 18.4 per 1,000 persons for females), diabetes (49.2% higher), CHD (86.8% higher) and lifestyle-related chronic conditions (31.2% higher). Conversely, mortality rates were higher in females than males for dementia (20.4% higher).
Sex differences in CHD mortality reduced to 24.3% in those 85 years and older (1,860.0 per 1,000 persons in males 85 years and older compared to 1,496.3 per 1,000 persons in females of the same age). A similar attenuation in sex difference in those 65 years and older for lifestyle-related chronic conditions was also evident.
Stroke and dementia showed a different pattern with the sex difference negligible until age 85 years and older, then increasing. For stroke, it become 19.1% higher among women 85 years and older. For dementia, the sex difference became 36.0% higher in women 85 years and older. Sex differences for mortality may reflect earlier mortality among males or mortality due to other causes (Figure 6).
Figure 6: Queensland mortality by selected chronic conditions, 2022
Remoteness and sociodemographic differences
Chronic disease mortality often varies geographically which, as described above, may indicate inequity. Generally, people living in more remote areas or lower socioeconomic areas had higher mortality rates from the selected chronic conditions in this section.
In 2022, Queensland standardised mortality rates in remote areas compared to major cities were:
- 56.8% higher for COPD (31.0 per 1,000 persons for remote areas compared to 19.7 per 1,000 persons for major cities)
- 37.3% higher for CHD
- 2.1 times higher for diabetes
- 19.8% higher for stroke
- 33.5% higher for the seven lifestyle-related chronic conditions.
Queensland standardised mortality rates in 2022 for the most disadvantaged areas compared to the most advantaged areas were (Figure 7):
- 2.0 times higher for COPD (29.6 per 1,000 persons for the most disadvantaged areas compared to 14.7 per 1,000 persons for the most advantaged areas)
- 89.2% higher for diabetes
- 22.7% higher for stroke
- 56.3% higher for CHD
- 55.6% higher for the seven lifestyle-related chronic conditions.
Figure 7: Queensland mortality for selected chronic conditions by remoteness and socioeconomic status, 2022
Trends
Reductions in deaths from circulatory conditions, such as CHD and stroke, are a contributing factor to declines in overall Queensland mortality rates. From 2002 to 2022, trends in standardised mortality rates per 100,000 for (Figure 8):17
- COPD declined by 13.1% over the period driven by a decrease of 30.5% in males.
- Diabetes decreased in females by 16.5% over the period.
- CHD decreased by 63.4% over the period with similar declines in males and females.
- Stroke declined by 46.7% over the period with similar decreases in males and females. This decrease, however, could be partly explained by the coding practice change of cerebrovascular diseases from 2006, which are now recorded as dementia.3
- Dementia increased by 160.3% over the period with similar increases in males and females. Again, some of the increase could be attributed to the coding practice change of cerebrovascular diseases.
- Lifestyle-related chronic conditions decreased by 44.5% over the period, driven in part by the decline in CHD and stroke mortality. Similar declines were observed for males and females.
Figure 8: Trends in Queensland mortality for selected chronic conditions
Burden of disease
Reductions in mortality for cardiovascular diseases and reduced hospitalisations for CHD contributed to improvements in health burden. Nationally, from 2003 to 2024, the standardised total burden rate for CHD declined from 21.0 to 8.9 per 1,000.3 Reductions occurred in standardised rates for both disability burden (3.7 to 1.8 per 1,000 persons) and premature death (17.3 to 7.1 per 1,000 persons). Similar improvements were seen for stroke (7.4 to 3.4 per 1,000 persons in total burden) but gains were higher for premature death (6.7 to 2.9 per 1,000 persons in total burden) than for disability burden (0.7 to 0.5 per 1,000 persons in total burden).
The burden from dementia has increased from 4.6 to 6.5 per 1,000 persons from 2003 to 2024. In 2024, dementia ranked 2nd out of all burden of disease conditions, and the ranking is the highest for females (4th for males). Just over two decades ago in 2003, the ranking for dementia was 13th, 17th and 10th for persons, males and females, respectively. While some increase may be attributable to changes in coding practices for death for stroke and dementia,3 as age is the biggest risk factor for the onset of dementia, increase in the prevalence from the aging population contributed greatly to the increase in the burden.
Smaller but important gains were made for standardised rates of total burden for COPD (6.6 to 5.7 per 1,000 persons), however, asthma saw an increase (4.9 to 5.3 per 1,000 persons). Negligible gains were seen for type 2 diabetes (3.8 to 3.7 per 1,000 persons), with improvements in premature death (2.0 to 1.4 per 1,000 persons) offset by an increase in disability burden (1.9 to 2.3 per 1,000 persons).
Most of the chronic disease health burden occurs in older age groups. Nevertheless, understanding differences in the age and sex profile in terms of chronic disease burden highlights potential intervention points. For example, asthma impacts all age groups throughout the life course whereas standardised rates for type 2 diabetes and dementia rapidly increase from the mid-40s (Figure 9).
Figure 9: Australian health burden for selected chronic conditions, 2024
Additional information
Data and statistics
Visit the following websites for more information:
- Results for Hospital and Health Services and other regions are available in this report under Regional Health
- Queensland Health Statistical Services Branch
- Australian Institute of Health and Welfare Chronic disease
- Australian Bureau of Statistics:
- Health conditions prevalence (See Health Conditions Prevalence)
- Long term health conditions (See Long term health conditions)
- 2021 Census (See Health: Census)
- World Health Organization Noncommunicable diseases and Australian Department of Health.
Strategies and information
Visit the Department of Health and Aged Care for information about:
Section technical notes
ASpR refers to age-specific rates.
Where presented, ratios were calculated using higher precision estimates than in text. Ratios calculated using estimates in text may differ.
Age-standardised rates were calculated by standardising to 2001 Australian standard population.
While age-specific rates for only the selected age groups were shown in Figure 3 and 6, the age standardised rates were calculated using all age groups.
For diabetes, only type 2 diabetes mellitus was presented in the Burden of disease section of this report due to data availability and stronger links to the lifestyle factors than other forms of diabetes.
Asthma mortality data were not presented due to small numbers.
Lifestyle-related chronic conditions are defined in this report as a group of seven chronic conditions that are major causes of disease burden and have the highest attributable risk factor burden (excluding alcohol related effects). They include CHD, stroke, lung cancer, colorectal cancer, breast cancer, COPD and diabetes.
Hospitalisation data reported in this section were sourced from the Queensland Hospital Admitted Patient Data Collection (QHAPDC). The QHAPDC is episode based, meaning that multiple episodes from a single person will be counted in a reporting period. Separations from interstate residents, public psychiatric hospitals, and those flagged as unqualified newborns, organ donors or boarders are excluded. Rehabilitation episodes were treated differently by condition in the 2023 release of this report. Such episodes are now included for all conditions to better represent the impact on hospitals. See additional information under About this report.
Mortality data presented in this section were sourced from the Australian Coordinating Registry held by the Statistical Services Branch, Queensland Health. Data are presented by year of death, rather than year of registration and are subject to change. Data excludes death of Queensland residents registered outside of Queensland. Data for remoteness and SEIFA excludes records that could not be clearly mapped to an ASGS version.
See the About this Report section of this report for trend analysis methods. In text, results are presented as the total increase or decrease over the specified time period. In graph hover boxes, the annual percentage change (APC) and 95% confidence intervals are presented. The APC is the average change per year over the time period.
ICD code groups have changed since the initial CHO report release to better align with other national reports and datasets noting that some differences remain including a subset that AIHW reapportions to jurisdiction of residence. Definitional changes have been applied to all years of data in the time series. See additional information under About this report.
Due to various data limitations, the ABS recommends data sources other than the Census, such as the NHS, to understand the prevalence of diseases in Australia.9 See Comparing ABS long term health conditions data sources on the ABS website for further details.
Figures on this page are interactive
To learn more about how to navigate interactive figures, dashboards, and visualisations see About this Report.
References
- World Health Organization. 2022. Noncommunicable diseases, https://www.who.int/news-room/fact-sheets/detail/noncommunicable-diseases, accessed 13 January 2023.
- World Health Organization. 2013. Global action plan for the prevention and control of noncommunicable diseases 2013-2020, World Health Organization, Geneva, https://apps.who.int/iris/handle/10665/94384.
- Australian Institute of Health and Welfare. 2024. Australian Burden of Disease Study 2024, https://www.aihw.gov.au/reports/burden-of-disease/australian-burden-of-disease-study-2024/contents/about, accessed 12 December 2024.
- Australian Institute of Health and Welfare. 2024. Health system spending on disease and injury in Australia 2022-23, https://www.aihw.gov.au/reports/health-welfare-expenditure/health-system-spending-on-disease-and-injury-aus/contents/about, accessed 29 November 2024.
- Landeiro F, Harris C, Groves D, et al. 2024. The economic burden of cancer, coronary heart disease, dementia, and stroke in England in 2018, with projection to 2050: an evaluation of two cohort studies, The Lancet Healthy Longevity, 5(8):e514–e523, doi:10.1016/S2666-7568(24)00108-9.
- Australian Institute of Health and Welfare. 2024. Chronic conditions, https://www.aihw.gov.au/reports/australias-health/chronic-conditions, accessed 8 January 2025.
- Australian Bureau of Statistics. 2023. National Health Survey (NHS) 2022, https://www.abs.gov.au/statistics/health/health-conditions-and-risks/national-health-survey/latest-release, accessed 10 April 2024.
- Australian Bureau of Statistics. 2022. Long-term health conditions, https://www.abs.gov.au/articles/long-term-health-conditions, accessed 13 June 2023.
- Australian Bureau of Statistics. 2022. Comparing ABS long-term health conditions data sources, https://www.abs.gov.au/statistics/detailed-methodology-information/information-papers/comparing-abs-long-term-health-conditions-data-sources, accessed 13 June 2023.
- Queensland Health. 2024. Queensland Hospital Admitted Patient Data Collection (QHAPDC), https://www.health.qld.gov.au/hsu/collections/qhapdc, accessed 15 March 2024.
- Australian Bureau of Statistics. 2023. Remoteness Areas, ASGS Edition 3 Remoteness Areas, Reference period: July 2021-June 2026, https://www.abs.gov.au/statistics/standards/australian-statistical-geography-standard-asgs-edition-3/jul2021-jun2026/remoteness-structure/remoteness-areas, accessed 8 July 2023.
- Australian Bureau of Statistics. 2023. Socio-Economic Indexes for Areas (SEIFA), Australia, Socio-Economic Indexes for Areas (SEIFA), Australia, https://www.abs.gov.au/statistics/people/people-and-communities/socio-economic-indexes-areas-seifa-australia/latest-release, accessed 8 July 2023.
- Australian Institute of Health and Welfare. 2024. Diabetes: Australian facts, https://www.aihw.gov.au/reports/diabetes/diabetes/contents/summary, accessed 8 January 2025.
- Queensland Health. 2011. Impact of changes in diabetes coding on Queensland hospital principal diagnosis morbidity data, Brisbane, https://www.health.qld.gov.au/hsu/tech_report/techreport_9.pdf [PDF 117 KB], accessed 18 March 2025.
- Queensland Health. 2011. Changes in diabetes coding from the fifth to the sixth and seventh editions of ICD-10-AM, Brisbane, https://www.health.qld.gov.au/__data/assets/pdf_file/0021/364530/techreport_8.pdf [PDF 140 KB], accessed 18 March 2025.
- Queensland Health. 2018. Impact of changes to coding of rehabilitation episodes of care, https://www.health.qld.gov.au/__data/assets/pdf_file/0033/703788/techreport-19.pdf [PDF 93 KB], accessed 4 November 2022.
- Australian Coordinating Registry. 2024. Cause of Death Unit Record File.