At a glance
In 2024:
- More than 5.8 million years of healthy life were lost due to illness and injuries nationally in 2024. Cancer and other neoplasms was the leading disease group, contributing 16.4% of the total burden.
- Coronary heart disease, dementia, back pain and problems, anxiety disorders and COPD were the leading specific diseases.
- For the first time, overweight (including obesity) was the leading contributing risk factor to health burden, surpassing tobacco use.
- Among the OECD countries, Australia compares well for fatal burden loss but had the 3rd highest years of healthy life lost in 2021.
Introduction
Burden of disease is a complex analytical method measuring the gap between the ideal of everyone living to old age in good health and people’s experience of illness and early death. This section mainly summarises the results from the most recent Australian Burden of Disease Study (ABDS), past ABDS jurisdictional results and international comparisons.
Australian burden of disease study
The Australian Institute of Health and Welfare (AIHW) conducts the Australian Burden of Disease Study (ABDS) by applying the best current health evidence for the Australian context.2 Since the first release of the Australian Burden of Diseases study in 1999,3 national results are updated regularly with periodic updates for regions within Australia and modifiable risk factors.
The most recent national ABDS study was in 2024. This included updates to modifiable risk factor estimates, the first since 2018. The most recent jurisdictional, remoteness, socioeconomic areas results are from 2018.4
In 2024, the Queensland Government released Queensland First Nations Peoples Burden of Disease Report 2018. A summary of results is included in the First Nations peoples section of this report.
Neither the 2024 ABDS nor the Queensland First Nations Burden of Disease study results can be compared to other burden of disease studies such as:
- the Global Burden of Disease (GBD) study because it was developed for the global health context and applies different methodologies
- earlier ABDS studies due to changes in health evidence and the addition of new diseases based on social and disease priorities, and emerging conditions.
AIHW recalculated national ABDS results for 2003, 2011, 2015 and 2018 using the 2024 methods. For jurisdictions and other small area analyses, the 2018 ABDS recalculated results from 2011. The most recent GBD results were for 2021.
2024 Australian Burden of Disease Study
From 2003 to 2024, the national health burden (DALYs):
- increased from 4.2 to 5.8 million years of healthy life lost
- the standardised rate decreased from 209.3 to 187.4 per 1,000 persons.
This inverse relationship between total burden and the standardised rate is due, in part, to increasing population size and changing age distributions. The reduction in DALY rates, however, has slowed in recent times. Between 2003 and 2018, a 10.9% decline was observed, while a slight increase in the standardised rates was observed from 2018 (186.4 per 1000) to 2024 (187.4 per 1000). Changes in the rate of premature death and health loss due to illness and disability from 2003 to 2024 were:
- 110.7 to 81.7 per 1,000 persons for fatal burden
- 98.6 to 105.7 per 1,000 persons for disability burden.
The decrease in total burden rate was driven by a decrease in fatal burden, which decreased from 53.1% of the total burden in 2003 to 46.1% in 2024. This reflects gains in preventing early deaths, while rates of health loss to illness and disability have increased. When looking at differences by sex:
- Australian males accounted for more years of healthy life lost than females—52.2% of the total burden. More than half the years lost to premature death were for males (58.4% of the total fatal health loss) while males contributed less than half of the years lost to illness/disability (46.8% disability burden).2
- In 2024, approximately 51.7% of the male total burden was fatal burden, while it was 40.1% for females.
- Since 2003, disability burden consistently outweighed fatal burden for females, and the difference widened in more recent time periods. While an increasing proportion of disability burden is also evident in males, fatal burden still outweighs disability burden.2
Increasing disability burden shows the impact of an ageing population. In future, greater effort will be required for hearing and vision disorders, arthritis and gout which impact mobility, and managing neurological disorders including dementia. Results also show the higher burden of chronic and disabling conditions that affect many young adults and middle-aged people including mental health disorders and musculoskeletal conditions such as back pain.
Health loss by disease group
In 2024, the leading disease group for health loss in Australia was cancer and other neoplasms, where almost all the burden was due to early death. Mental and substance use disorders, musculoskeletal disorders, cardiovascular diseases followed closely. Together these four disease groups explained more than half the total burden. Figure 1 shows the distribution of the disease groups and the associated diseases.
Figure 1: Health burden for disease groups and associated conditions, 2024
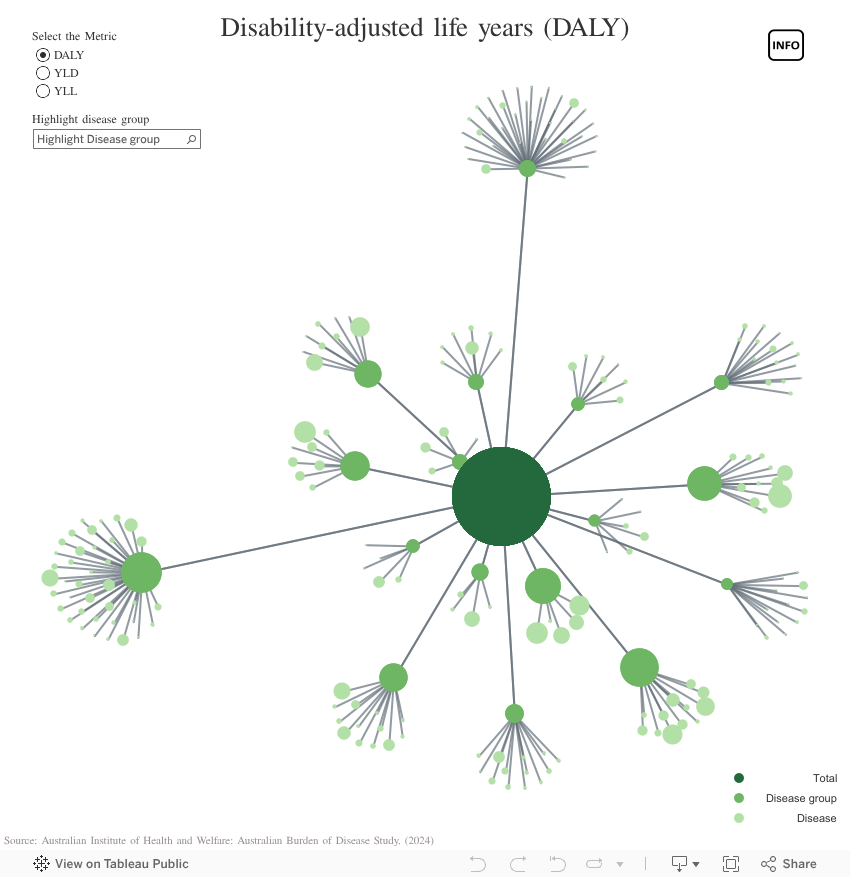
If dashboard does not load, view the dashboard in Tableau.
Musculoskeletal conditions, and mental health and substance use disorders have relatively high disability burden while cancers, injury and cardiovascular diseases have high fatal burden. Some changes in the leading disease groups from 2003 to 2024 were:2
- cancer and other neoplasms: 26.8% decline in the standardised rate but a 22.5% increase in the number of DALYs
- mental and substance use disorders: 30.9% increase in the standardised rate and a 73.8% increase in the number of DALYs
- musculoskeletal disorders: 4.7% decline in the standardised rate and a 45.8% increase in the number of DALYs
- cardiovascular diseases: 47.0% decrease in the standardised rate and a 7.1% decrease in the number of DALYs
- neurological conditions: 16.3% increase in the standardised rate and a 100.8% increase in the number of DALYs.
Over this period the burden for infectious diseases increased (64.7% increase in number of DALYs), largely driven by the increase from the COVID-19 pandemic from 2018 and 2024.
Health loss by select specific causes
In 2024, the leading specific causes of health loss were:
- coronary heart disease
- dementia
- back pain and problems
- anxiety disorders
- chronic obstructive pulmonary disease (COPD).2
These accounted for 18.1% of the total disease burden. More than half of the burden from these leading conditions was disability burden, indicating that management will require ongoing, long term care. This is the nature of the changing health burden—the dominance of chronic conditions, impacting the wellbeing of the individual and driving demand for ongoing health and support services.
There was a substantial increase in health burden due to dementia, osteoarthritis, hearing loss, falls, asthma, COPD, back pain, suicide and rheumatoid arthritis since 2003—again reflecting an ageing population and the emergence of disabling/non-fatal conditions.2
The greatest improvements in reducing burden were achieved for coronary heart disease and stroke which can be attributed to success in primary prevention through better monitoring of blood pressure and cholesterol, reduced smoking rates, and advances in treatment and early clinical intervention. Changes in recording of death from stroke also contributed to this decline.2
Although rates of burden increased with age, substantial health burden were experienced in younger age groups, especially as disability burden (Figure 2). Delaying the onset of chronic diseases would have long-term benefits to individuals and the healthcare sector as younger people age.
Figure 2. Australian premature death (YLL) and disability (YLD) health burden by age and sex, 2024
Risk factor burden
A large proportion of health burden can be attributed to modifiable risk factors, many of which are lifestyle-related. In 2024, 35.8% of total burden could have been avoided or reduced based on the combined effects of the risk factors included in the ABDS.2 Substantial proportions of the health burden for associated diseases are also attributable to modifiable risk factors (Figure 3). Risk factors contributed more to fatal burden (45.9% of the total YLL) than to disability burden (27.2% of the total YLD).2
35.8% of the 2024 total health burden was attributable to modifiable risk factors.
Obesity (including overweight)
In 2024, overweight (including obesity) was the leading risk factor for health burden in Australia.2 This was the first time that the burden from overweight and obesity surpassed the burden from tobacco use since the inception of the ABDS. Overweight (including obesity) accounted for 8.3% of the health burden in Australia with its impact evident in a range of diseases including cardiovascular disease and cancer. Although the burden from overweight and obesity has increased from 0.3 million in 2003 to 0.5 million in 2024, when adjusted by age, the rate of burden reduced from 15.2 per 1000 to 14.3 per 1000 in the same period. This was driven by the decline from the rate of fatal burden (9.6 per 1000 to 7.4 per 1000), in particular from coronary heart disease, mediating the increase in the rates of disability burden (5.6 per 1000 to 6.9 per 1000) from diseases such as type 2 diabetes and osteoarthritis.
Tobacco
Tobacco use was the second ranked risk, accounting for 7.6% of the total health burden in Australia. The percentage attributable has reduced from 10.4% in 2003, as has the standardised rate (21.6 per 1000 in 2003 to 12.7 per 1000 in 2024). Success of anti-smoking campaigns contributed to decline both in the fatal and disability burden from smoking. However, tobacco use continues to be a large cause of burden because of its very substantial contribution to fatal outcomes, particularly lung cancer and COPD. The long lag between smoking exposure and developing tobacco-related health conditions means that tobacco will remain a significant contributor to burden for the foreseeable future. Preventing the uptake of smoking in young people has been a critical factor in reducing smoking rates and associated disease in Australia. Smoking cessation, especially reducing the age that people quit, also plays an important role.
Diet
The combined effects of dietary risks are a significant contributor to health loss (4.8% of the total health burden), including coronary heart disease and type 2 diabetes. There are complex relationships between the dietary and other risk factors. For example, poor diet, which is a risk factor for 16 diseases, contributes to 9 conditions that are also attributed to being overweight or obese. Dietary risks also contribute to 11 diseases that are also attributable to tobacco use.
Figure 3 shows the network of complex relationships between risk factors and their associated diseases. It also presents the amount of health burden for a specific condition attributable to the risk factor. For example, half of the coronary heart disease burden, the leading individual cause of burden in Australia, is estimated to be attributable to dietary risks (noting that this does not consider the joint effects of other risk factors on coronary heart disease).
Figure 3: Attributable burden of risk factors to associated diseases, 2024
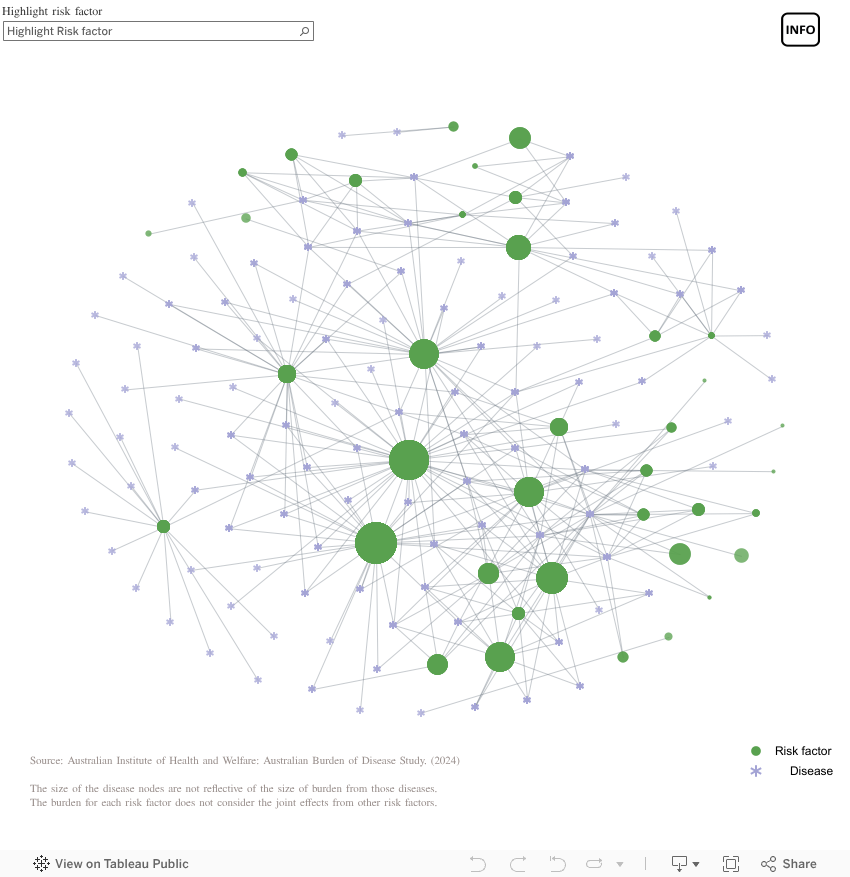
If dashboard does not load, view the dashboard in Tableau.
2018 Australian Burden of Disease Study
National comparisons
In 2018 (the most recent Queensland estimate), Queenslanders lost more than 1.0 million years of healthy life.4 In 2018, the total burden standardised rate in Queensland (189.6 per 1,000 population) was similar to most other jurisdictions except the Northern Territory (Figure 4) which was higher.
Figure 4: Jurisdictional burden of disease rates, 2018
In Queensland, the standardised rate of burden decreased from 2011 to 2018—from 196.6 to 189.6 DALYs per 1,000 persons.4 The proportion of life lost due to illness/disability in Queensland increased and in 2018, was 52.0% disability burden.4
Remoteness and socioeconomic differences
In Australia, the standardised rate of total burden in remote and very remote areas in 2018 was 1.4 times higher than in major cities.4 If all areas had the same rates of burden as major cities, the total burden in Australia would have been 4.4% lower. Kidney and urinary diseases were the most prominent disease groups contributing to this difference. Injury, infectious diseases, endocrine disorders and cardiovascular diseases also played a part. The fatal burden was 75.2% higher in remote areas than major cities, while the disability burden was 12.8% higher.
Socioeconomic disadvantage was also a significant contributor to total burden. If all areas in Australia had the same rates of burden as the least disadvantaged areas the total burden in 2018 would have been 21.4% lower.4 The burden rate in the most disadvantaged areas was 1.6 times higher than in the least disadvantaged areas.
Endocrine disorders contributed greatly to this socioeconomic difference (2.3 times higher in most disadvantaged areas), along with injury (2.0 times higher) and kidney and urinary diseases (1.9 times higher). Fatal burden rates in the most disadvantaged areas were 85.7% higher than in the least disadvantaged areas, while the disability burden rate was 35.5% higher.
This would indicate there is much to be gained in reducing fatal outcomes for disadvantaged and remote populations, many of which also have a higher prevalence of modifiable risk factors such as tobacco use, higher alcohol consumption, unhealthy weight and poor diets.
Global Burden of Disease study
The results from the GBD 2021 can be used to compare Australia with other countries and regions. Results for Australia in the GBD will differ from those in the ABDS, due to the different methodologies applied.
Globally, 2.88 billion healthy years were lost in 2021, increasing from 2.63 billion in 2010.5 Main drivers of the increases are thought to be population growth and ageing, as the standardised rates have declined. DALY rates, however, have increased during the COVID-19 pandemic globally. The increases during this period were more pronounced in low-income countries, but were also observed among high-income countries. In terms of risk factors contributing to the burden, high blood pressure, smoking, high fasting plasma glucose (high blood sugar level), low birth weight and high body-mass index were the leading risk factors for the burden globally.
Compared to other participating Organisation for Economic Co-operation and Development (OECD) countries, Australia performed favourably for fatal burden. For all causes in 2021, Australia was 31st highest out of 38 OECD countries for standardised YLL rates. Relatively, Australia did not observe a large increase in YLL rates during the COVID-19 pandemic. The gap between Australia and countries with high YLL rates, such as Mexico, increased in 2021 compared to pre-pandemic period. Australian YLD rates, however, were among the highest. Australia ranked 3rd highest, after the United States of America and New Zealand (Figure 5).6 For overall disease burden, Australia was ranked 28th highest. The leading causes of health loss in Australia were similar to other high-income countries in the OECD and globally—cancers, cardiovascular disease, musculoskeletal disorders and mental disorders.
Figure 5: Burden of disease rates by OECD countries, 2021
Based on GBD forecasts, standardised DALY rates for Australia are expected to decline moderately—from 19,454.7 per 100,000 in 2021 to 17,615.1 per 100,000 in 2050 (Figure 6). This is driven by a decline in fatal burden rates, offsetting the relatively unchanged disability burden rates. Despite declining rates, the amount of burden experienced by the nation is expected to increase—from 6.7 million DALYs in 2021 to 9.9 million DALYs in 2050. However, it is predicted that improvement in behavioural and metabolic risks in Australia could reduce DALYs in 2050 to 9.0 million.7
Figure 6: Burden of disease rates forecast for Australia
Additional information
Data and statistics
Where presented, ratios were calculated using higher precision estimates than those that are displayed within the report.
Visit the AIHW website for more information about the Australian Burden of Disease studies:
- Burden of disease overview
- Australian Burden of Disease Study 2024
- Australian Burden of Disease Study: Impact and causes of illness and death in Australia 2018
- Australian Burden of Disease Study 2018: Interactive data on risk factor burden.
Visit the Institute of Health Metrics and Evaluation website for more information about the Global Burden of Disease (GBD).
For Queensland First Nations Burden of Disease 2018 study, see First Nations Australians burden of disease.
Section technical notes
Technical information for ABDS is available on the AIHW website:
- Australian Burden of Disease Study: Methods and supplementary material 2018
- Australian Burden of Disease Study 2024 Technical notes
For details on the GBD methodologies, please visit the Global Burden of Disease (GBD) page on the Institute for Health Metrics and Evaluation website and the related publications.
Figures on this page are interactive
To learn more about how to navigate interactive figures, dashboards, and visualisations see About this Report.
References
- Brauer M, Roth GA, Aravkin AY, et al. 2024. Global burden and strength of evidence for 88 risk factors in 204 countries and 811 subnational locations, 1990–2021: a systematic analysis for the Global Burden of Disease Study 2021, The Lancet, 403(10440):2162–2203, doi:10.1016/S0140-6736(24)00933-4.
- Australian Institute of Health and Welfare. 2024. Australian Burden of Disease Study 2024, https://www.aihw.gov.au/reports/burden-of-disease/australian-burden-of-disease-study-2024/contents/about, accessed 12 December 2024.
- Mathers C, Vos T and Stevenson C. 1999. The burden of disease and injury in Australia, Australian Institute of Health and Welfare, Canberra.
- Australian Institute of Health and Welfare. 2021. Australian Burden of Disease Study: Impact and causes of illness and death in Australia 2018, doi:10.25816/5PS1-J259.
- Ferrari AJ, Santomauro DF, Aali A, et al. 2024. Global incidence, prevalence, years lived with disability (YLDs), disability-adjusted life-years (DALYs), and healthy life expectancy (HALE) for 371 diseases and injuries in 204 countries and territories and 811 subnational locations, 1990–2021: a systematic analysis for the Global Burden of Disease Study 2021, The Lancet, 403(10440):2133–2161, doi:10.1016/S0140-6736(24)00757-8.
- Institute for Health Metrics and Evaluation (IHME). 2024. GBD Compare Data Visualization, IHME, University of Washington, Seattle, WA, http://vizhub.healthdata.org/gbd-compare, accessed 24 December 2024.
- Institute for Health Metrics and Evaluation (IHME). 2024. GBD Foresight Data Visualization, IHME, University of Washington, Seattle, WA, https://vizhub.healthdata.org/gbd-foresight, accessed 24 December 2024.