At a glance
- In 2023, the leading cause of death in Queensland was coronary heart disease in males and dementia including Alzheimer’s disease in females.
- Queensland standardised mortality rates in 2021–2023 were 28.8% higher in very remote areas than in major cities and 38.8% higher in the most disadvantaged areas compared to the most advantaged.
- The Queensland standardised mortality rate decreased 61.1% from 1971 to 2023 which was consistent with national trends.
Introduction
Mortality is used internationally as an indicator of overall population health and socioeconomic development. Differences in mortality patterns are commonly used in public health to identify new pathogens, exposure to harmful substances or conditions, and underlying inequities that may negatively impact health.
Key statistics
In 2023, 36,622 Queensland residents died with an age-standardised mortality rate (ASR or standardised rate) of 5.2 per 1,000 persons. Females had a lower standardised mortality rate (4.4 per 1,000) than males (6.2 per 1,000).1
- The Queensland standardised mortality rate was similar to the Australian rate (5.1 per 1,000 persons) and Queensland ranked 5th among the eight Australian jurisdictions.1
- Median age at death in Queensland in 2023 was 80.8 years (78.6 for males and 83.5 years for females) compared to 82.0 years for Australia overall.1
- More than a third (35.9%) of deaths were for people 85 years and older.2
Infant mortality
In 2023, there were 259 infant deaths (defined as deaths before 12 months of age) in Queensland, resulting in an infant mortality rate of 4.4 per 1,000 live births.1 The Australian infant mortality rate was 3.2 per 1,000 live births and Queensland ranked 6th among the eight Australian jurisdictions with the Northern Territory and the Australian Capital Territory recording higher infant mortality rates.1
Perinatal mortality
In 2022, there were 781 perinatal deaths in Queensland (including stillborn infants and deaths in the first 28 days).3 Of these, 72.5% were stillbirths. The perinatal death rate was 12.7 per 1,000 births.3
Queensland ranked 7th in 2022 among the jurisdictions based on the national definition of perinatal deaths with only the Northern Territory having a higher perinatal mortality rate.4
Mortality trends
In 1971, the Queensland standardised mortality rate was 12.7 per 1,000 persons declining to 5.2 per 1,000 persons in 2023 (Figure 1).1 From 1971 to 2023, the Queensland standardised mortality rate decreased 61.1% with males having a greater average annual rate of decline than females (declines of 63.1% and 56.8%, respectively). Queensland trends were similar to the Australian population as whole (Figure S1).
The Queensland median age of death increased from 70.4 years to 80.8 years from 1971 to 2023 (Figure S1).1
Queensland’s infant mortality rate decreased from 15.7 per 1,000 live births in 1974 to 4.4 per 1,000 live births in 2023 (Figure 1). Since the mid-1990s the rate of decline in infant mortality rates has slowed (infant mortality rates declined a total of 57.6% from 1974 to 1995 but by 39.9% from 1995 to 2023). This pattern was evident for both males and females and similarly reflected for the Australian population as a whole (Figure S1).1
Figure 1: Queensland mortality rates
Age at death
Older people have a higher risk of death than younger age groups. Age distributions are changing in most developed countries with older age groups making up a larger proportion of the total population. This phenomenon, along with an increasing population size, means that the total number of deaths will continue to increase. For this reason, age-specific rates and age-standardised rates, both of which adjust for changing age distributions, better monitor changes in mortality trends over time.
In 2023, 35.9% of Queensland deaths were among adults 85 years and older (Figure 2), while this age group makes up only 1.9% of the population.2
Figure 2: Age distribution of deaths by age and sex in 2023
Remoteness and socioeconomic differences
Queensland is a diverse state with areas classified from major cities to remote or very remote based on travel distances to the nearest service centre.5 Socioeconomic differences in mortality metrics are assessed using the area-based index of socioeconomic advantage and disadvantage.6
Mortality rates and median age at death worsen as socioeconomic status decreases and as remoteness increases. On average:
- The standardised mortality rate for 2021–2023 was 28.8% higher in very remote areas than in major cities (6.7 and 5.2 per 1,000 persons, respectively), while the median age at death was 6.5 years younger (75.2 years in very remote areas and 81.7 years in major cities).
- The standardised mortality rate in 2023 was 38.8% higher in the most advantaged areas compared to the most disadvantaged while the median age at death was 3.0 years younger.
Differences by remoteness were also evident during the period 2021–2023 with infant mortality rates 34.2% greater in inner/outer regional areas and 15.8% greater in remote and very remote areas compared to major cities (Figure 3). Queensland’s infant mortality rate was higher than the corresponding national rate in major cities (3.8 per 1,000 live births for Queensland, 3.0 for Australia) and inner/outer regional areas (5.1 per 1,000 live births for Queensland, 3.6 for Australia), but was lower in remote and very remote areas (4.4 per 1,000 live births for Queensland, 6.0 for Australia; Figure 3).7
Figure 3: Selected mortality measures by remoteness and socioeconomic status for Queensland
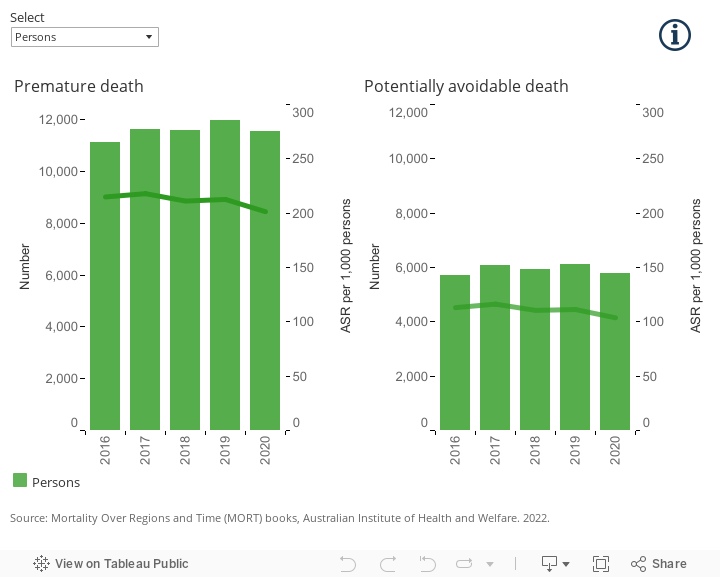
Premature and potentially avoidable deaths
Measures of avoidable mortality, such as premature and potentially avoidable deaths, provide a broad indication of the effectiveness of health care systems and public health strategies. Premature deaths are defined as death before 75 years of age. A subset of premature deaths from certain conditions are considered potentially avoidable meaning that they could have been prevented with individualised care or through existing health care services. In this report, potentially avoidable deaths (PADs) are classified using the National Healthcare Agreement definition.8
In Queensland in 2022:
- The percentage of premature deaths was 33.7% and of those, 48.8% were classified as potentially avoidable.9
- Males had a higher standardised premature death rate (2.7 per 1,000) than females (1.6 per 1,000). Males also had a higher standardised rate of potentially avoidable deaths (1.4 and 0.8 per 1,000 for males and females, respectively).9
- The standardised premature death rate in Queensland was similar to the national rate (2.1 per 1,000 compared to 2.1 per 1,000 persons, respectively) and Queensland ranked 6th among the Australian states and territories.9
Figure 4: Queensland premature and potentially avoidable deaths
If dashboard does not load, view the dashboard in Tableau
Leading causes of death
In 2023 the leading cause of death was coronary heart disease, followed by dementia including Alzheimer’s disease (Figure 5).10
COVID-19 was the 9th ranked cause of death in Queensland in 2023, down from 6th in 2022. In 2023, there were 814 deaths due to COIVD-19.10
Using the average number of deaths over a range of years stabilises leading causes by smoothing periodic variation in some health conditions. From 2018–2022, the leading cause of death for Queensland residents was coronary heart disease, with dementia including Alzheimer’s disease the leading cause for females and coronary heart disease the leading cause of death for males (Figure 5).9 The top five leading causes of death in this 5-year period in Queensland were:
- Coronary heart disease: 11.2% of all deaths (12.3% for males and 9.9% for females)
- Dementia including Alzheimer’s disease: 9.0% of all deaths (6.2% for males and 12.1% for females)
- Cerebrovascular disease: 5.9% of all deaths (4.8% for males and 7.3% for females)
- Lung cancer: 5.7% of all deaths (6.1% for males and 5.2% for females)
- Chronic obstructive pulmonary disease: 4.4% of all deaths (4.5% for males and 4.3% for females).
Figure 5: Queensland leading causes of death
Additional information
Data and statistics
The visualisations below provides more detailed information for mortality.
Supplemental Figure S1: Mortality measures
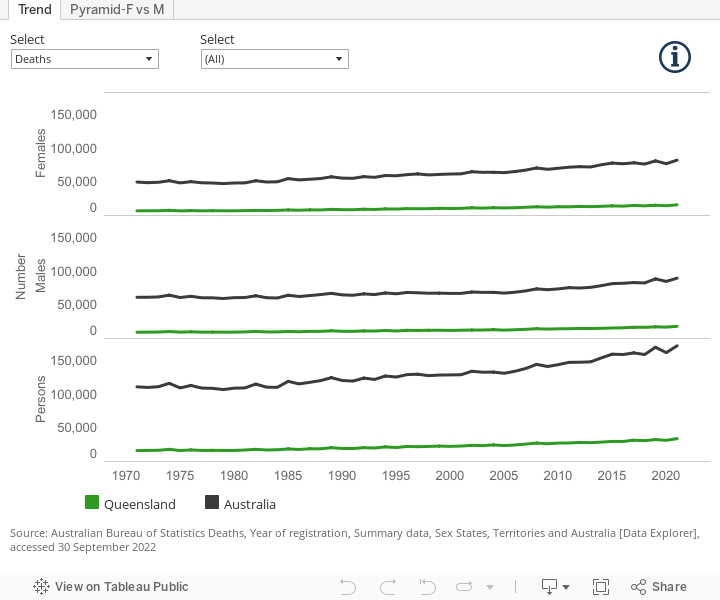
If dashboard does not load, view the dashboard in Tableau
Section technical notes
See the About this Report section of this report for trend analysis methods. In text, results are presented as the total increase or decrease over the specified time period. In graph hover boxes, the annual percentage change (APC) and 95% confidence intervals are presented. The APC is the average change per year over the time period.
Age-standardised rates of data from the the ABS Data Explorer and the AIHW Mortality Over Regions and Time (MORT) books were calculated by standardising to the 2001 Australian standard population.
Data shown by remoteness category are averaged using data for the three years ending in the reference year. Refer to Deaths, Australia for further information.
Mortality data for SEIFA presented in this section were sourced from the Australian Coordinating Registry data held by the Statistical Services Branch, Queensland Health. Data are presented by year of death, rather than year of registration and are subject to change.
Death data for recent periods are preliminary and subject to change. Refer to Causes of Death, Australia on the Australian Bureau of Statistics website for further information.
For ICD codes used to define health conditions, see About this Report
Figures on this page are interactive
To learn more about how to navigate interactive figures, dashboards, and visualisations see About this Report.
References
- Australian Bureau of Statistics. 2024. Deaths, Year of registration, Summary data, Sex, States, Territories and Australia, https://explore.data.abs.gov.au/vis?fs[0]=ABS%20Topics%2C0%7CPEOPLE%23PEOPLE%23&fs[1]=ABS%20Topics%2C2%7CPEOPLE%23PEOPLE%23%7CPopulation%23POPULATION%23%7CDeaths%23DEATHS%23&pg=0&fc=ABS%20Topics&df[ds]=ABS_ABS_TOPICS&df[id]=DEATHS_SUMMARY&df[ag]=ABS&df[vs]=1.0.0&pd=2009%2C&dq=1%2B2%2B3%2B4%2B5%2B6%2B7%2B8%2B9%2B10%2B11.3.AUS.A&ly[cl]=TIME_PERIOD&ly[rw]=MEASURE, accessed 10 October 2024.
- Australian Bureau of Statistics. 2024. Deaths, Year of registration, Age at death, Age-specific death rates, Sex, States, Territories and Australia, https://explore.data.abs.gov.au/vis?fs[0]=ABS%20Topics%2C0%7CPEOPLE%23PEOPLE%23&fs[1]=ABS%20Topics%2C2%7CPEOPLE%23PEOPLE%23%7CPopulation%23POPULATION%23%7CDeaths%23DEATHS%23&pg=0&fc=ABS%20Topics&df[ds]=ABS_ABS_TOPICS&df[id]=DEATHS_AGESPECIFIC_REGISTRATIONYEAR&df[ag]=ABS&df[vs]=1.0.0&pd=2009%2C&dq=12.3.TOT%2BA04%2BA59%2BA10%2BA15%2BA20%2BA25%2BA30%2BA35%2BA40%2BA45%2BA50%2BA55%2BA60%2BA65%2BA70%2BA75%2BA80%2BA85%2BA90%2BA95%2BA99%2B999..A&ly[cl]=TIME_PERIOD&ly[rw]=AGE&ly[rs]=REGION, accessed 10 October 2024.
- Queensland Health. 2024. Queensland perinatal statistics 2022, Queensland Government, Brisbane, https://www.health.qld.gov.au/hsu/peri/peri2022/queensland-perinatal-statistics-2022, accessed 10 October 2024.
- Australian Institute of Health and Welfare. 2024. Australia’s mothers and babies, AIHW, Canberra, https://www.aihw.gov.au/reports/mothers-babies/australias-mothers-babies/contents/about, accessed 24 September 2024.
- Hugo Centre for Population and Migration Studies. 2018. Accessibility/Remoteness Index of Australia (ARIA), https://able.adelaide.edu.au/hugo-centre/services/aria, accessed 1 October 2022.
- Australian Coordinating Registry. 2024. Cause of death unit record file, https://www.qld.gov.au/law/births-deaths-marriages-and-divorces/data/national-data, accessed 10 October 2024.
- Australian Bureau of Statistics. 2024. Deaths, Australia 2023, Australian Bureau of Statistics, https://www.abs.gov.au/statistics/people/population/deaths-australia/2023, accessed 10 October 2024.
- Australian Institute of Health and Welfare. 2021. National healthcare agreement: PI 16–potentially avoidable deaths, 2022, https://meteor.aihw.gov.au/content/740864, accessed 10 October 2022.
- Australian Institute of Health and Welfare. 2024. Mortality Over Regions and Time (MORT) books: State and territory, 2018 - 2022, https://www.aihw.gov.au/reports/life-expectancy-deaths/mort-books/contents/mort-books, accessed 10 October 2024.
- Australian Bureau of Statistics. 2024. Causes of death, Australia, 2023, ABS, Canberra, https://www.abs.gov.au/statistics/health/causes-death/causes-death-australia/2023, accessed 10 October 2024.