At a glance
- Based on measured height and weight in 2022, 2.74 million (68.8%) Queensland adults were overweight or obese—1.36 million (34.1%) were overweight and 1.37 million (34.6%) were obese. Among Queensland children 5 to 17 years, 286,500 (32.6%) were overweight or obese.
- Regional differences were observed, for example in 2024, those living in Queensland’s most disadvantaged areas were 2.3 times more likely to be obese (adults) and 2.6 times more likely to be overweight or obese (children) based on self-reported and parent-reported height and weight.
- In Queensland, self-reported adult obesity increased by 45.5% from 2004 to 2024 and parent-reported child overweight and obesity increased by 10.3% from 2011 to 2024. Sociodemographic differences were evident.
Introduction
Overweight and obesity are complex public health challenges. Many factors contribute to unhealthy weight, including genes and family history, social and environmental factors, lifestyle behaviours, some medicines, and health conditions a person may have, or had previously.1
Significant health burden on the individual and healthcare system is attributable to overweight and obesity. The health impacts of overweight and obesity for adults include type 2 diabetes, cardiovascular disease, musculoskeletal conditions, and cancer. Childhood obesity can have physical and psychological health impacts and is strongly associated with obesity in adulthood.1,2
Overweight and obesity contributes significantly to morbidity and mortality for several health conditions, and to health care expenditure:
- In 2024, overweight and obesity accounted for 8.3% of the total burden of disease (DALY).
- Considered individually, the highest proportions of disease-specific burden attributable to overweight and obesity were for type 2 diabetes mellitus (54.5% of type 2 diabetes mellitus burden) followed by hypertensive heart disease (51.4%) and uterine cancer (51.2%).3
- The estimated healthcare costs attributable to obesity ranged from $1.5 billion to $4.6 billion per year (in 2016–17 dollars). The corresponding annual costs from productivity loss due to obesity ranged from $0.84 billion to $14.9 billion.4
Latest results
Measured height and weight have been routinely collected in the National Health Survey (NHS), most recently in 2022. Body mass index (BMI) based on measured height and weight is more accurate than self-reported height and weight, but in-person measurement is costly and therefore collected less frequently. Further, due to the voluntary and sensitive nature of this measurement, increasing numbers of participants decline to have their height and weight measured. In the 2022 NHS, 40.8% of adults and 56.8% of children declined to be measured. The NHS is used for comparisons across jurisdictions, and age-standardised (or standardised) proportions that remove the effects of age are reported when available to account for population distribution differences.5
Self-reported height and weight for Queenslanders are collected annually by telephone interview on a larger sample as part of the Queensland preventive health survey (QPHS).6 In this report, the larger sample of self-reported height and weight allows reporting by population subgroups and provides more information for trend analysis.
Adults
The proportion of Queensland adults who are overweight or obese is high. Based on measured height and weight from the 2022 NHS, more than two-thirds (68.8%) of adult Queenslanders were overweight (34.1%) or obese (34.6%).7
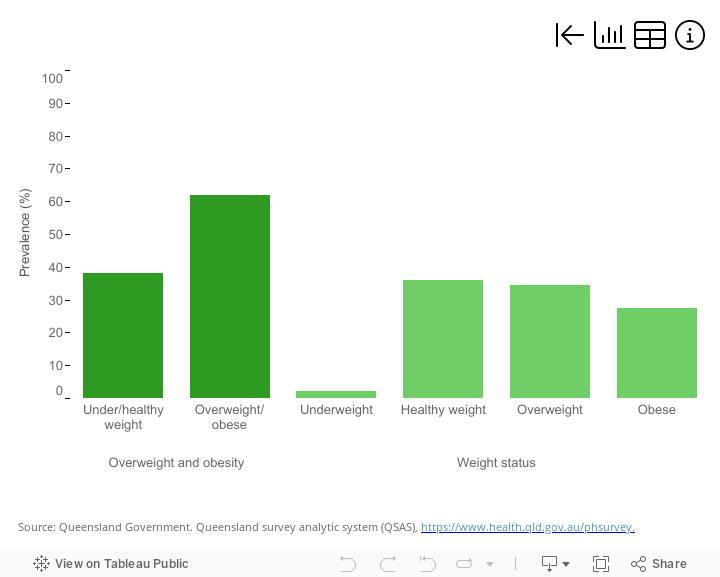
Based on self-reported height and weight from the QPHS, almost two-thirds (62.7%) of Queensland adults were overweight (34.9%) or obese (27.8%) in 2024.
Comparing Queensland adults across sociodemographic groups showed obesity was (Figure 1):
- 2.0 times more likely among adults 45 to 64 years than adults 18 to 29 years (34.4% and 16.9%, respectively)
- 2.3 times more likely among adults living in the most disadvantaged areas compared to adults living in the most advantaged areas
- 59.9% more likely among adults living in remote and very remote areas than those living in major cities.
While there was no difference in obesity between adult males and females, males were 51.8% more likely than females to be overweight.8
Figure 1: Adult self-reported weight status in Queensland, 2024
If dashboard does not load, view the dashboard in Tableau.
Children and young people
Based on measurements taken in the 2022 NHS, about one-third of children were overweight or obese (32.6%).7
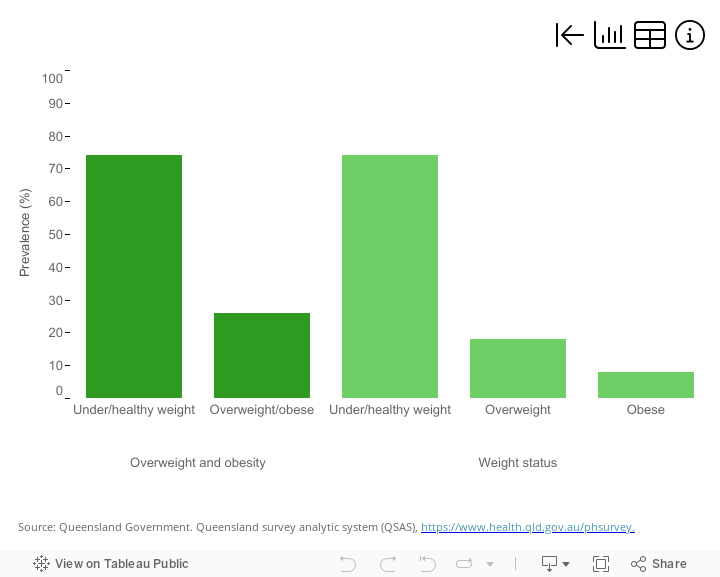
Based on parent-reported height and weight in 2024, 26.4% of children living in Queensland were overweight or obese (17.9% and 8.5%, respectively).
Comparing Queensland children across sociodemographic groups showed overweight and obesity was (Figure 2):
- 28.7% more likely among children 5 to 11 years than children 12 to 17 years (29.5% and 22.9%, respectively)
- 2.6 times more likely among children living in the most disadvantaged areas compared to children living in the most advantaged areas.8
Figure 2: Child parent-reported weight status in Queensland, 2024
If dashboard does not load, view the dashboard in Tableau.
Trends
Based on measured height and weight from the five most recent triennial NHS surveys:
- Among Queensland adults, the standardised proportion of measured obesity increased sharply from 25.0% in 2007–08 to 30.0% in 2011–12, followed by a more gradual increase to 33.8% in 2022.
- There was no change in other weight categories for Queensland adults.
Nationally, the standardised adult obesity proportion was 24.4% in 2007–08 and steadily increased to 31.1% in 2022.
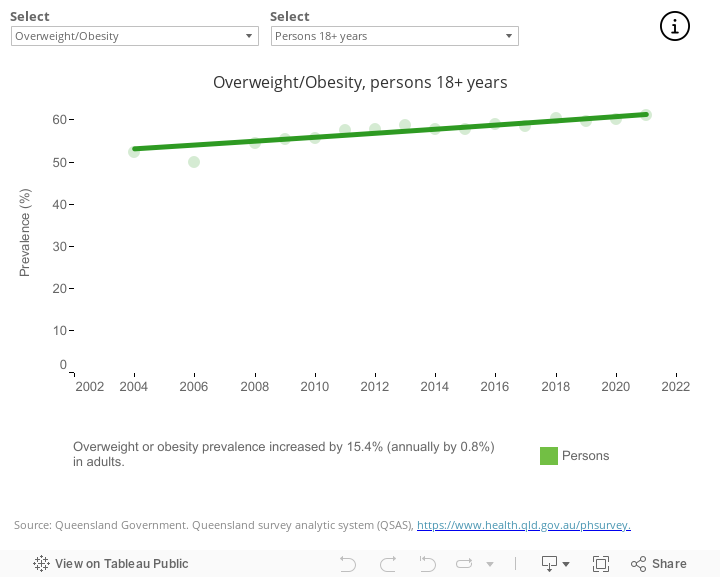
Based on self-reported height and weight, the proportion of overweight and obesity among Queensland adults continues to increase. From 2004 to 2024 the proportion of Queensland adults who were:
- overweight or obese increased by 17.9%
- obese increased by 45.5%.
The increase in the proportion of Queensland adults who were obese from 2004 to 2024 was similar for males and females and across age groups, and differed by:
- socioeconomic status, with a 78.4% increase among adults in the most disadvantaged areas compared to a 28.4% increase among adults in the most advantaged group
- remoteness, with obesity among adults living in inner regional areas increasing at a faster rate over the period than those living in major cities or outer regional areas.
Based on parent-reported height and weight, the proportion of Queensland children who were overweight or obese increased by 10.3% from 2011 to 2024. This increase differed by socioeconomic status, with a 39.7% increase among children in the most disadvantaged group but no evidence of change for children in the most advantaged group.
While the proportion of Queensland children who were obese was stable across the same period, there were differences between:
- age groups with a 45.7% increase among children 12 to 17 years but no evidence of change for children 5 to 11 years
- socioeconomic groups with a 39.9% increase among most disadvantaged children but no evidence of change for the most advantaged group.8
Figure 3: Queensland trends in weight status
If dashboard does not load, view the dashboard in Tableau.
National comparisons
Based on measured height and weight in 2022, there was no evidence of a difference in the standardised proportion of adult:
- overweight and obesity in Queensland compared to the national proportion (67.8% in Queensland compared to 64.8% nationally)
- obesity in Queensland compared to the national proportion (33.8% in Queensland compared to 31.1% nationally).
Among the states and territories, Queensland ranked 7th for overweight and obesity among adults, and 7th for adult obesity with only Tasmania having higher proportions of overweight and obese adults.
In 2022, there was no evidence of a difference between the standardised proportion of overweight and obesity in Queensland children 5 to 17 years (32.6%) and the national proportion (27.7%). Among the states and territories, Queensland was ranked 7th for child overweight and obesity proportion with only the Northern Territory having a higher proportion of children who were overweight and obese.
Compared to 2017–18, the standardised proportion of overweight and obesity in Queensland children increased by 32.5% while the national increase was 11.2%.7
Additional information
Data and statistics
Summary results from the Queensland preventive health survey (QPHS) for Our regions can be found within this report and more detailed and historical results can be accessed at Queensland Preventive health surveys.
Strategies and information
For obesity strategies and information about maintaining a healthy weight see:
- The Department of Health and Aged Care National Obesity Strategy 2022–2032
- Cancer Council Queensland Maintain a healthy weight.
For Health and Wellbeing Queensland prevention programs see:
- Making healthy happen: A strategy for preventing obesity in Queensland
- My health for life to take a personal health check and learn more about healthy lifestyles
- Country Kitchens
- Healthier Tuckshops Program.
Section technical notes
Counts of people by modifiable risk factors are estimated by applying the indicator proportion to the relevant estimated resident population (ERP). More information about ERP is available from the Australian Bureau of Statistics
- National, state and territory population.
- Data on government and non-government students, staff and schools.
Where presented, ratios were calculated using higher precision estimates than in text. Ratios calculated using estimates in text may differ.
BMI categories for adults are as described at Body mass index (BMI) and waist measurement. BMI categories for children are defined in a paper by Cole.9
Data for this section were sourced from:
- Queensland preventive health survey (QPHS) (See Preventive health surveys for further information)
- Australian Bureau of Statistics National Health Survey 2022 (See National Health Survey 2022 for further information).
Figures on this page are interactive
To learn more about how to navigate interactive figures, dashboards, and visualisations see About this Report.
References
- Commonwealth of Australia. 2022. The National Obesity Strategy 2022-2032. Health Ministers Meeting, https://www.health.gov.au/resources/publications/national-obesity-strategy-2022-2032?language=en, accessed 3 March 2023.
- World Health Assembly 70. 2017. Report of the Commission on Ending Childhood Obesity: implementation plan: report by the Secretariat, World Health Organization, Geneva, https://apps.who.int/iris/handle/10665/274900, accessed 13 March 2025.
- Australian Institute of Health and Welfare. 2024. Australian Burden of Disease Study 2024, https://www.aihw.gov.au/reports/burden-of-disease/australian-burden-of-disease-study-2024/contents/about, accessed 12 December 2024.
- Crosland P, Ananthapavan J, Davison J, et al. 2019. The economic cost of preventable disease in Australia: a systematic review of estimates and methods, Australian and New Zealand Journal of Public Health, 43(5):484–495.
- Australian Bureau of Statistics. 2023. National Health Survey methodology, https://www.abs.gov.au/methodologies/national-health-survey-methodology/2022#cite-window1, accessed 14 November 2024.
- Queensland Health. 2023. About the preventive health survey and Queensland survey analytic system, https://www.health.qld.gov.au/research-reports/population-health/preventive-health-surveys/about, accessed 14 November 2024.
- Australian Bureau of Statistics. 2024. National Health Survey (NHS) 2022, https://www.abs.gov.au/statistics/health/health-conditions-and-risks/national-health-survey/latest-release, accessed 14 November 2024.
- Queensland Health. 2024. Queensland preventive health survey, https://www.health.qld.gov.au/research-reports/population-health/preventive-health-surveys/about, accessed 14 November 2024.
- Cole TJ. 2000. Establishing a standard definition for child overweight and obesity worldwide: international survey, BMJ, 320(7244):1240–1240, doi:10.1136/bmj.320.7244.1240.