At a glance
- In 2022, 1.5 million (36.4%) Queensland adults exceeded the risky drinking guideline—986,000 were male and 515,000 were female.
- In 2022–2023, 189,000 (49.9%) Queensland high school students (age 12 to 17 years) had consumed alcohol in the previous 12 months and 96,000 (25.5%) had consumed alcohol in the previous four weeks.
- In 2022, twice as many males as females exceeded the risky drinking guideline in Queensland (48.9% for males and 24.5% for females).
- The prevalence of risky drinking in the Queensland adult population decreased by 5.3% from 2012 to 2022.
Introduction
Alcohol is widely used in Australian society and many people drink at levels that pose little risk to health. However, drinking above recommended limits has many social and health impacts affecting individuals, families and communities. Consuming alcohol at high levels substantially increases the risk of injury, road traffic accidents and potentially self-harm. Longer term health impacts include a variety of conditions, such as cancer, liver disease, heart disease, and alcohol use disorders.1
Alcohol consumption contributes significantly to morbidity and mortality for several health conditions, and to health care expenditure:
- In 2024, risky alcohol consumption accounted for 4.1% of the total burden of disease (DALYs).
- Considered individually, the highest proportions of disease-specific burden attributable to alcohol consumption were for alcohol use disorders (all of alcohol use disorders burden) followed by liver cancer (39.2%) and other oral cavity and pharynx cancers (36.8%).2 Results for all the conditions linked to alcohol consumption are available in the Burden of Disease section of this report.
- The estimated healthcare costs attributable to alcohol ranged from $1.9 billion to $2.6 billion per year (in 2016–17 dollars) and estimates of the corresponding annual costs from productivity loss attributable to alcohol ranged from $1.1 billion to $6.8 billion.3
Latest results
Adults
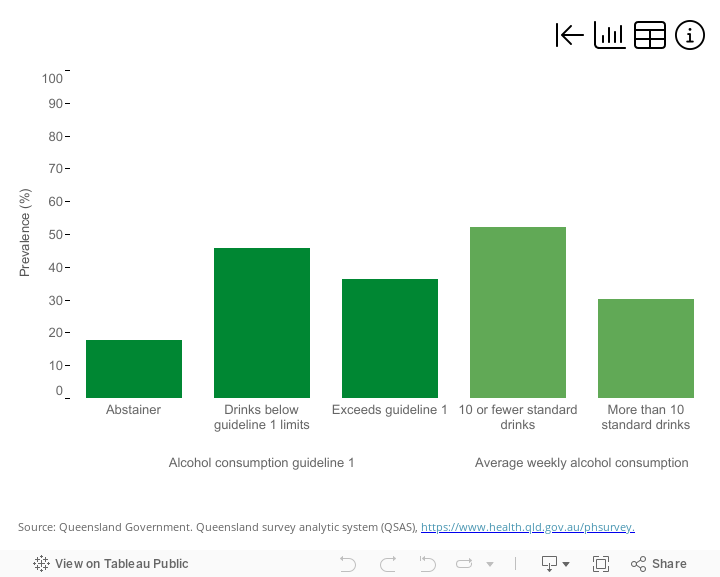
In 2022, more than one-third (36.4%) of adult Queenslanders consumed alcohol at levels that were risky to their health.
Comparing Queensland adults across sociodemographic groups showed consuming alcohol at risky levels was (Figure 1):
- 2.0 times more likely among males than females (48.9% for males and 24.5% for females)
- 70.8% more likely among adults 18 to 29 years than adults 65 years or more
- 21.0% more likely among adults living in remote and very remote areas than those living in major cities.
If you’re concerned about your own or someone else’s alcohol and other drug use, find help and support on the Queensland Government website, call ADIS (24/7 alcohol and drug support) on 1800 177 833 or visit the ADIS QLD Homepage.
In 2022, 17.8% of Queensland adults abstained from alcohol consumption, defined as consuming no alcohol in the past 12 months. Comparing adults across sociodemographic groups showed abstaining from drinking alcohol was (Figure 1):
- 66.6% more likely among females than males (22.1% for females and 13.2% for males)
- 93.2% more likely among adults 65 years or more than adults 18 to 29 years
- 81.4% more likely among adults living in the most disadvantaged areas compared to adults living in the most advantaged areas.4
Figure 1: Adult alcohol consumption by selected characteristics, 2022
If dashboard does not load, view the dashboard in Tableau.
Children and young people
In 2022–2023, half (49.9%) of Queensland high school students had consumed alcohol in the past 12 months, a quarter (25.5%) had consumed any alcohol in the past four weeks and 13.4% had consumed alcohol in the past week.
The proportions of Queensland high school students drinking alcohol in the past 12 months did not differ for males and females, but differed across age groups. Among Queensland high school students, the proportion who had consumed alcohol in the past 12 months was (Figure 2):
- 33.4% for students 12 to 13 years
- 54.0% for students 14 to 15 years
- 64.9% for students 16 to 17 years.5
Figure 2: Alcohol consumption of Queensland high school students in the past 12 months, 2022-2023
Trends
Adults
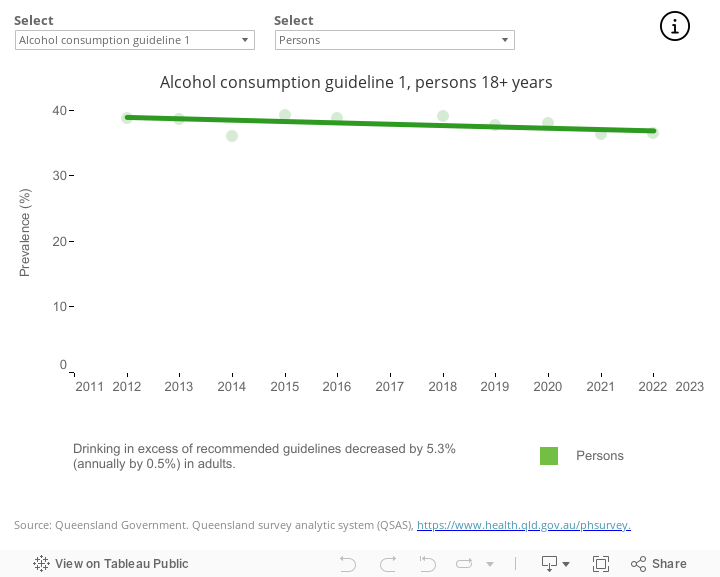
The proportion of Queensland adults who engaged in risky drinking decreased by 5.3% from 2012 to 2022 with no differences in the rate of change by sex, age, or socioeconomic or remoteness areas.
While there were no significant differences between sociodemographic groups, some modest decreases were observed in selected subgroups (Figure 3). From 2012 to 2022, the proportion of adults who engaged in risky drinking decreased in males by 6.7%, decreased by 10.2% in those 30 to 44 years, and decreased by 6.9% in adults living in major cities. Whether these trends are sustained will be assessed as additional years of data become available.4
Figure 3: Trends in adult alcohol consumption in Queensland
If dashboard does not load, view the dashboard in Tableau.
Children and young people
Cancer Council Victoria has conducted the Australian Secondary Students’ Alcohol and Drug (ASSAD) survey since 1984. The ASSAD survey, conducted in the school environment, collects information from secondary school students about their preventive health behaviours. Implementing this survey following the COVID pandemic period was challenging and led to changes in methodology. Some caution is advised when interpreting changes over time.
The proportion of Queensland high school students drinking alcohol in the past 12 months decreased by 4.2% from 2017 to 2022–2023 which was similar to the decrease for all Australian high school students (4.6%), although decreases were not significant at the state or national level.
Among Queensland students, the proportion of students who drank alcohol in the past 12 months was stable from 2017 to 2022–2023 for male and female students. Among Queensland students 16 to 17 years, there was a decrease of 20.0% compared to no change in younger age groups. Among all Australian school students in the same period, a similar pattern was evident across age groups (12.4% for Australian students 16 to 17 and no change for student 12 to 15 years).5,6
National comparisons
In 2022, risky alcohol consumption among Queensland adults did not differ from the national proportion (Queensland: 29.7% compared to Australia: 27.1%). Queensland ranked 4th among the Australian states and territories.7
There was no evidence that the proportion of high school students who had consumed alcohol in the past 12 months in Queensland differed from the Australian proportion (49.9% for Queensland compared to 43.7% for Australia).5,6
Additional information
Data and statistics
Summary QPHS results for Hospital and Health Services and other regions can be found within this report at Our regions and more detailed and historical results can be accessed at Queensland Preventive health surveys.
Strategies and information
If you’re concerned about your own or someone else’s alcohol and other drug use, find help and support on the Queensland Government website, call ADIS (24/7 alcohol and drug support) on 1800 177 833 or visit the ADIS QLD Homepage.
The National Alcohol Strategy 2018–2028
Achieving balance: The Queensland Alcohol and Other Drugs Plan2022-2027
Section technical notes
Counts of people by modifiable risk factors are estimated by applying the indicator prevalence to the relevant estimated resident population (ERP). More information about ERP is available from the Australian Bureau of Statistics
- National, state and territory population.
- Data on government and non-government students, staff and schools.
Where presented, ratios were calculated using higher precision estimates than in text. Ratios calculated using estimates in text may differ.
Data for this section were sourced from:
- the Queensland preventive health survey (QPHS) (See Queensland Preventive health surveys for further information)
- the Australian Secondary School Alcohol and Drugs Survey (ASSAD) (See Australian secondary school students alcohol and drug survey for further information). A smaller sample size (10,314 students nationally) was achieved in 2022-2023 than in past years.
- the Australian Bureau of Statistics (ABS) release of the National Health Survey (See Alcohol consumption for further information).
Data collection methods differ between the National Health Survey and the QPHS and estimates should not be compared.
The 2020 alcohol consumption guidelines are based on a standard drink defined as containing 10g of alcohol. Average consumption of more than ten standard drinks per week (lifetime risky drinking) or more than four standard drinks on any one day (single occasion risky drinking) is considered to increase the risks of harm from alcohol.
The 2020 guidelines were released in December 2020 and superseded the 2009 guidelines. The changes to the guidelines have been summarised in the factsheet found at Preventive health reports.
Figures on this page are interactive
To learn more about how to navigate interactive figures, dashboards, and visualisations see About this Report.
References
- National Health and Medical Research Council. 2020. Australian guidelines to reduce health risks from drinking alcohol, National Health and Medical Research Council, Canberra, Australian Capital Territory, https://www.nhmrc.gov.au/about-us/publications/australian-guidelines-reduce-health-risks-drinking-alcohol.
- Australian Institute of Health and Welfare. 2024. Australian Burden of Disease Study 2024, https://www.aihw.gov.au/reports/burden-of-disease/australian-burden-of-disease-study-2024/contents/about, accessed 12 December 2024.
- Crosland P, Ananthapavan J, Davison J, et al. 2019. The economic cost of preventable disease in Australia: a systematic review of estimates and methods, Australian and New Zealand Journal of Public Health, 43(5):484–495, doi:10.1111/1753-6405.12925.
- Queensland Health. 2024. Queensland preventive health survey, https://www.health.qld.gov.au/research-reports/population-health/preventive-health-surveys/about, accessed 10 September 2024.
- Department of Health and Aged Care. 2024. Australian secondary school students alcohol and drug (ASSAD) survey 2022-2023, https://www.health.gov.au/resources/collections/australian-secondary-school-students-alcohol-and-drug-survey, accessed 13 December 2024.
- Scully M, Bain E, Koh, Ian, et al. 2023. ASSAD 2022/2023: Australian secondary school students’ use of alcohol and other substances, Cancer Council Victoria, Melbourne, https://www.health.gov.au/resources/collections/australian-secondary-school-students-alcohol-and-drug-survey, accessed 21 December 2023.
- Australian Bureau of Statistics. 2023. National Health Survey (NHS) 2022, https://www.abs.gov.au/statistics/health/health-conditions-and-risks/national-health-survey/latest-release, accessed 10 April 2024.