Introduction
Regional health profiles are impacted by the sociodemographic characteristics of the area. Age distributions, in particular, influence the types and levels of health conditions that are more common.
Presentation of results in this section
In this section, regional results may be presented for a single year or be based on two or more years combined. This is because multiple years of data may be needed to produce reliable results in areas that have smaller population sizes. When this occurs, Queensland results are also provided for this same time period, and will therefore differ from Queensland results in the main sections of this report.
Another difference with Queensland results in this section is that they may be derived from a different data source than in the main sections of this report. This is because regional information was not available from the same source.
Both age-standardised (ASR or standardised rates), which adjust for different age distributions across areas, and crude rates that may better reflect current health service utilisation, are provided in most cases.
Mortality
A selection of mortality rates are described below. Additional mortality rates are available in Figure 1.
In Queensland in 2020–2022:
- Crude all cause mortality rates were highest in Wide Bay HHS, Central West HHS and Darling Downs HHS (1,000.0, 909.5 and 817.7 per 100,000 persons, respectively)
- Standardised all cause mortality rates were highest in Torres and Cape HHS, North West HHS and Central West HHS (785.7, 778.5 and 636.2 per 100,000 persons, respectively).
For mortality due to specific conditions, in 2020–2022 in Queensland:
- The regions with the highest crude mortality rates for 7 lifestyle-related chronic conditions were Wide Bay HHS, Central West HHS and Darling Downs HHS (352.0, 333.6 and 280.4 per 100,000 persons, respectively)
- The regions with the highest age-standardised mortality rates for 7 lifestyle-related chronic conditions were Torres and Cape HHS, North West HHS and Central West HHS (283.2, 280.3 and 224.3 per 100,000 persons, respectively)
- The regions with the highest crude mortality rates for coronary heart disease were Wide Bay HHS, Darling Downs HHS and Central West HHS (103.7, 97.1 and 91.3 per 100,000 persons, respectively).
Hospitalisations
A selection of hospitalisation rates are described below. Additional hospitalisation rates are available in Figure 1.
For all-cause hospitalisations in Queensland in 2022–23:
- Crude rates were highest in North West HHS, Wide Bay HHS and Townsville HHS (74,772, 66,329 and 61,851 per 100,000 persons, respectively)
- The regions with the highest age-standardised rates were North West HHS, Torres and Cape HHS and Townsville HHS (80,032, 66,980 and 56,921 per 100,000 persons, respectively).
In Queensland in 2022–23, hospitalisation rates for specific groups of conditions varied across hospital and health service regions with:
- The highest crude rates for total potentially preventable hospitalisations in Torres and Cape HHS, North West HHS and Wide Bay HHS (6,253, 6,049 and 5,603 per 100,000 persons, respectively)
- The highest crude rates of hospitalisation for dementia in Wide Bay HHS, Sunshine Coast HHS and Gold Coast HHS (138, 124 and 107 per 100,000 persons, respectively).
Figure 1: Mortality and hospitalisations by region, Queensland
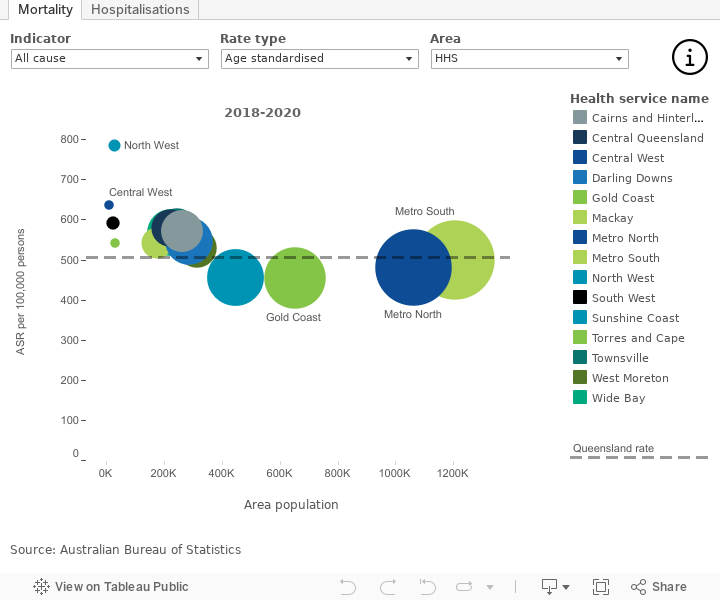
If dashboard does not load, view the dashboard in Tableau
Cancer
Cancer and other neoplasms is a group of conditions with one of the highest disease burdens and a leading cause of death in Australia.1 According to the latest available data for Australia, cancer ranks highest for health system expenditure on broad disease groups.2
A selection of cancer indicators is described below. Additional cancer indicators are available in Figure 2.
Screening
In Queensland:
- From 2019 to 2020, breast cancer participation rates were highest in Townsville HHS (63.6%), Mackay HHS (60.6%) and Central West HHS (57.9%)
- From 2020 to 2021, bowel cancer screening participation rates were highest in Sunshine Coast HHS (42.2%), Wide Bay HHS (42.1%) and Metro North HHS (39.0%).
Incidence
In 2022:
- The regions with the highest crude all cancer incidence were Wide Bay HHS, Sunshine Coast HHS and Darling Downs HHS (991.9, 819.3 and 779.0 per 100,000 persons, respectively)
- The regions with the highest crude incidence of melanoma were Wide Bay HHS, Sunshine Coast HHS and Gold Coast HHS (139.4, 99.5 and 99.1 per 100,000 persons, respectively)
- The regions with the highest crude incidence of breast cancer among females were Wide Bay HHS, Sunshine Coast HHS and Darling Downs HHS (85.2, 82.9 and 77.2 per 100,000, respectively).
Mortality
In 2022:
- The regions with the highest crude mortality rates for all cancers were Wide Bay HHS, Central West HHS and Darling Downs HHS regions (297.9, 280.0 and 240.7 per 100,000 persons, respectively)
- The regions with the highest crude mortality rates for lung cancer were Central West HHS, Wide Bay HHS and Mackay HHS regions (93.3, 69.9 and 49.9 per 100,000 persons, respectively)
- The regions with the highest crude mortality rates for prostate cancer were Wide Bay HHS, South West HHS and Darling Downs HHS regions (23.4, 20.7 and 20.0 per 100,000, respectively).
Figure 2: Cancer screening, incidence and mortality by region in Queensland, 2022
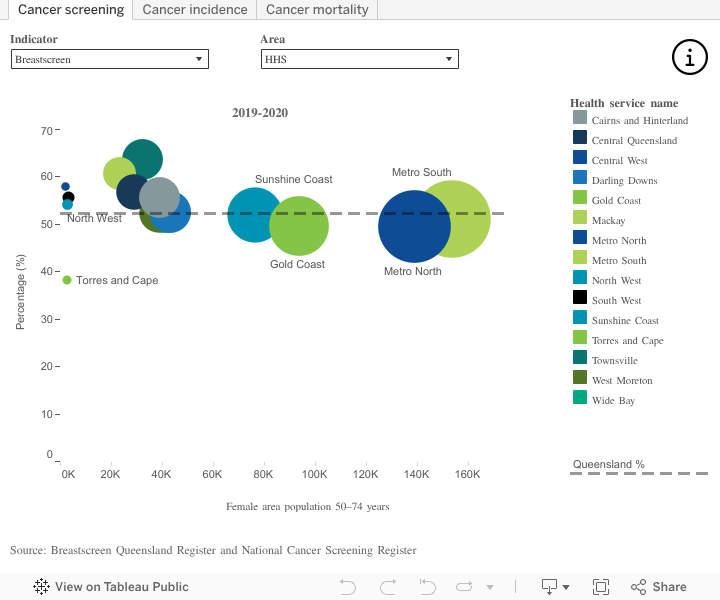
If dashboard does not load, view the dashboard in Tableau
Selected long-term health conditions
In the 2021 Census, questions about long-term health conditions were asked for the first time. While other data sources, such as the NHS, remain the recommended primary source for long-term condition prevalence, the 2021 Census data provided important regional insights.3–5
In 2021 in Wide Bay HHS (Figure 3):
- 42.3% of people (56.4% for those 45 years and older) reported having at least one long-term health condition
- 6.3% (10.7% for adults 45 years and older) reported having three or more long-term health conditions
- 15.4% reported having arthritis and 12.0% reported having a mental health condition (including depression or anxiety).
In 2021 in Darling Downs HHS:
- 36.4% of people (52.8% for those 45 years and older) reported having at least one long-term health condition
- 4.4% of people (8.9% for adults 45 years and older) reported having three or more long-term health conditions.
Figure 3: Selected long-term health conditions by region in Queensland, 2021

If dashboard does not load, view the dashboard in Tableau
Additional information
Data and statistics
Data in this section were sourced from:
- Queensland Cancer Control Analysis Team (See Cancer Alliance Queensland for further information)
- BreastScreen Queensland (See Cancer screening for further information)
- National Bowel Cancer Screening Program (See Cancer screening for further information)
- 2021 Census (See Health: Census for further information).
Further information
Australian Bureau of Statistics:
- Health conditions prevalence (See Health Conditions Prevalence for further information)
- Long-term health conditions (See Long-term health conditions for further information).
Australian Institute of Health and Welfare:
- Chronic disease (See Chronic disease for further information).
Section technical notes
The 7 lifestyle-related chronic conditions (with ICD-10-AM codes) include: breast cancer (C50), lung cancer (C33-C34), colorectal cancer (C18-C20), COPD (J40-J44), coronary heart disease (I20-I25), stroke (I60-I64), and diabetes (E10-E14).
The ABS recommends the use of data sources other than the Census, such as the NHS, to understand the prevalence of diseases in Australia, due to various Census data limitations.3 See Comparing ABS long-term health conditions data sources on the ABS website for further details. Other factors to consider when interpreting the Census long-term health condition information are:
- When comparing across regions, it is important to note that older people are at higher risk of developing long-term health conditions. Regions with higher proportions of older people, such as Wide Bay HHS (with more than a quarter of the population 65 years and older in 2020), are likely to also have higher proportion of people with these conditions.
- the proportion who did not state whether they have long-term health conditions varied by region—ranging from 6.9% in Metro North HHS to 15.2% in Torres and Cape HHS. The proportion of participants with missing responses who may have a long-term health condition is unknown. In line with ABS reporting, missing responses were included in calculations (in the proportion denominator) and results should be interpreted accordingly.
Figures on this page are interactive
To learn more about how to navigate interactive figures, dashboards, and visualisations see About this Report.
References
- Australian Institute of Health and Welfare. 2021. Cancer in Australia 2021, doi:10.25816/YE05-NM50, accessed 13 March 2025.
- Australian Institute of Health and Welfare. 2024. Health system spending on disease and injury in Australia 2022-23, https://www.aihw.gov.au/reports/health-welfare-expenditure/health-system-spending-on-disease-and-injury-aus/contents/about, accessed 29 November 2024.
- Australian Bureau of Statistics. 2023. National Health Survey (NHS) 2022, https://www.abs.gov.au/statistics/health/health-conditions-and-risks/national-health-survey/latest-release, accessed 14 November 2024.
- Australian Bureau of Statistics. 2022. Long-term health conditions, https://www.abs.gov.au/articles/long-term-health-conditions, accessed 13 June 2023.
- Australian Bureau of Statistics. 2022. Comparing ABS long-term health conditions data sources, https://www.abs.gov.au/statistics/detailed-methodology-information/information-papers/comparing-abs-long-term-health-conditions-data-sources, accessed 13 June 2023.