Introduction
Queenslanders have diverse lifestyles that often reflect where they live. The environment, access to services, social norms and demography influence the modifiable risk and protective factors in different regional areas.
The data dashboards below compare population-weighted proportions of selected lifestyle behaviours in Queensland regions:
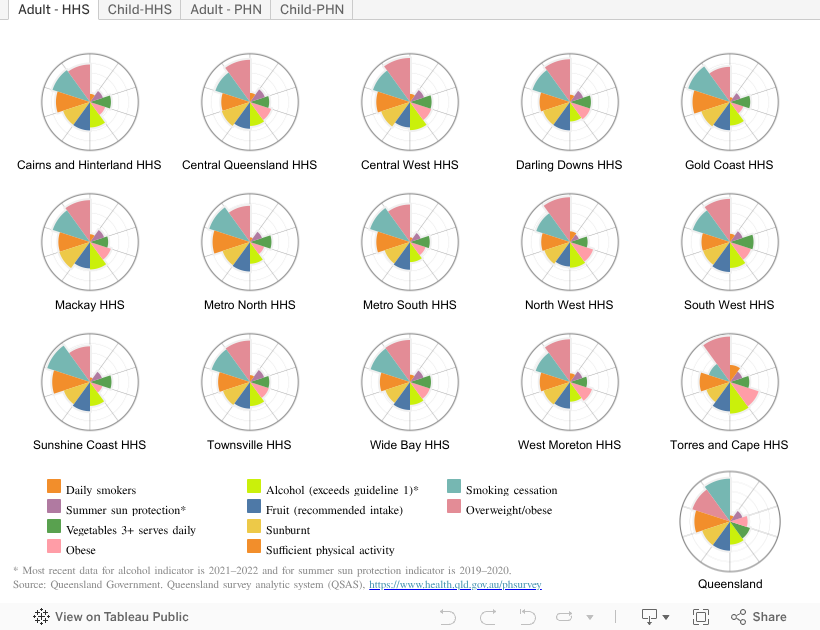
- Figure 1 is a petal chart for comparing the current population proportions of lifestyle behaviours in each Hospital and Health Service (HHSs) and Primary Health Network (PHNs). A larger “petal” indicates a higher proportion. A hover box will show the proportion when the cursor is placed over a petal.
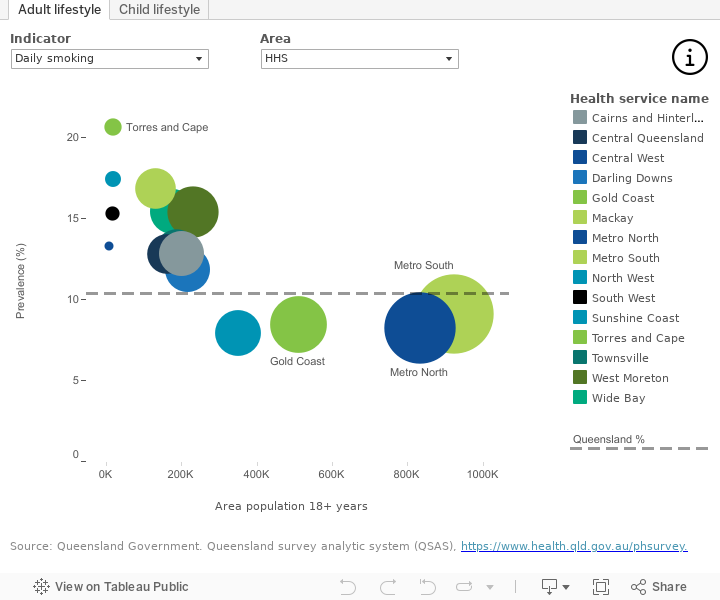
- Figure 2 is a bubble chart and shows the current population proportions based on the population size for each HHSs and PHNs.
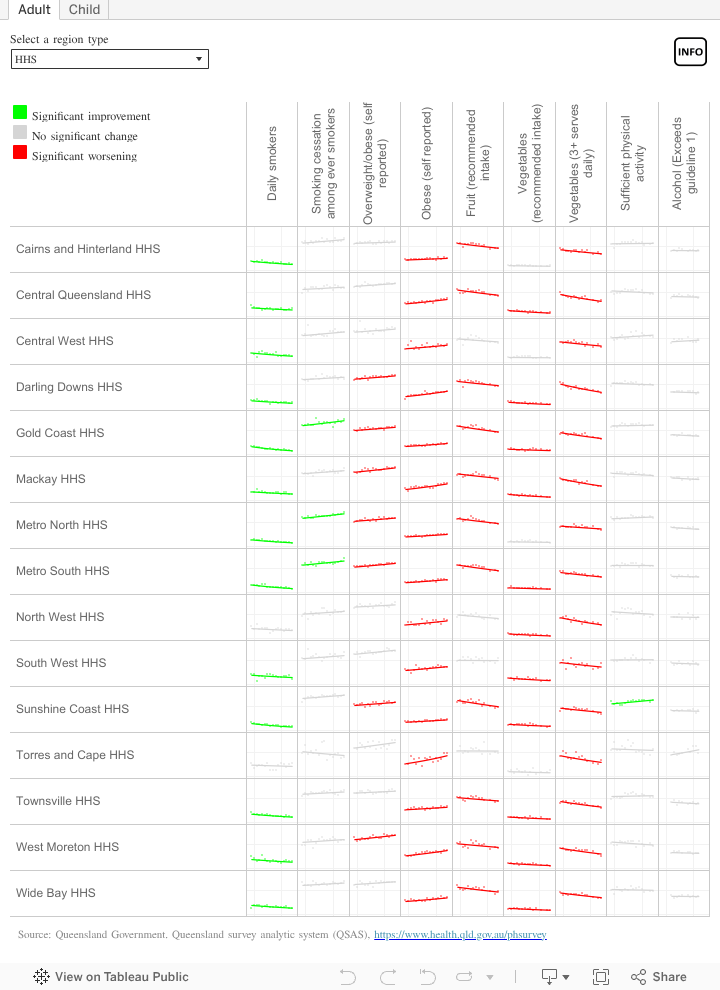
- Figure 3 is a matrix of trend results by region. Trends that are improving are coloured green while those that are worsening are red. Hovering over the trend for a specific risk factor and region will bring up a larger version of that trend plot.
Latest Queensland regional risk factor results
Figure 1 presents regional results for 10 adult and 6 child, modifiable risk factors. As examples, a subset have been described below.
Adults
For the period 2023–2024, the HHSs with the highest proportion of (Figure 1):
- adult daily smoking were Torres and Cape HHS (27.8%), North West HHS (17.4%) and Central Queensland HHS (14.8%)
- adult smokers who have quit smoking were Sunshine Coast HHS (73.4%), Gold Coast HHS (71.7%) and Metro North HHS (69.8%)
- adults who were overweight or obese were Torres and Cape HHS (74.2%), North West HHS (73.0%) and Central West HHS (71.9%).1
Children and young people
For the period 2023–2024, HHSs with the highest proportion of (Figure 1):
- children who were overweight or obese were Central West HHS (44.3%), North West HHS (42.1%), and Mackay HHS (38.6%)
- sufficient childhood physical activity were South West HHS (72.7%), Torres and Cape HHS (66.6%) and Wide Bay HHS (53.8%).1
Figure 1: Queensland regional risk factors, 2023–2024
If dashboard does not load, view the dashboard in Tableau
Regions compared to Queensland
Figure 2 shows the regions compared to Queensland overall. Information about the estimated number of people practising modifiable risk factors is also provided. As for Figure 1, examples for a subset of indicators are described below.
Adults
In 2023–2024 (Figure 2):
- the HHSs with proportions of adult daily smokers higher than the Queensland average were Torres and Cape HHS, North West HHS, Central Queensland HHS, West Moreton HHS, South West HHS, Cairns and Hinterland HHS, Central West HHS, Mackay HHS, Wide Bay HHS, and Darling Downs HHS
- the total number of daily smokers in HHSs with a higher proportion than the Queensland average was estimated to be 166,000
- the total number of daily smokers in HHSs with a lower proportion than the Queensland average was estimated to be 177,000.1
Children
In 2023–2024 (Figure 2):
- the HHSs with proportions of obese children higher than the Queensland average were North West HHS, Mackay HHS, and West Moreton HHS
- the total number of obese children in HHSs with a higher proportion than the Queensland average was estimated to be 15,000
- the total number of obese children in HHSs with a lower proportion than the Queensland average was estimated to be 12,000.1
Figure 2: Lifestyle behaviours by region and population in Queensland, 2023–2024
If dashboard does not load, view the dashboard in Tableau
Trends
The data dashboard below shows how some lifestyle behaviours have changed in regional populations over time. Green trend lines show an improvement over time and red lines show a worsening over time. A grey line indicates no significant change.
Results are not reportable for some regions because of small counts.
For adults (Figure 3):
- The regions with the largest decreases, measured as an average annual percentage change (APC), in daily smoking prevalence from 2009 to 2024 were Gold Coast HHS (5.0% decrease per year on average), Sunshine Coast HHS (4.7% decrease per year on average) and Metro South HHS (4.4% decrease per year on average)
- The regions with the largest average annual increases in obesity prevalence from 2009 to 2024 were Torres and Cape HHS (3.3% increase per year on average), Mackay HHS (2.8% increase per year on average) and Darling Downs HHS (2.5% increase per year on average).
For children from 2013 to 2024 (Figure 3):
- The regions with the largest average annual percentage decreases in prevalence of daily consumption of three serves of vegetables were South West HHS (6.7% decrease per year on average), West Moreton HHS (6.6% decrease per year on average) and North West HHS (5.7% decrease per year on average)
- The regions with the largest average annual percentage increases in prevalence of sufficient physical activity were Metro South HHS (3.2% increase per year on average), Central Queensland HHS (3.2% increase per year on average) and Mackay HHS (2.9% increase per year on average).1
Figure 3: Trends in lifestyle behaviours by region in Queensland
If dashboard does not load, view the dashboard in Tableau
Additional information
Strategies and information
Summary results from the Queensland preventive health survey (QPHS) for Hospital and Health Services and other regions can be found within this report and more detailed and historical results can be accessed at Preventive health surveys.
Section technical notes
Data in this section were sourced from the Queensland preventive health survey (QPHS) (See Preventive health surveys for further information)
Prevalence results reported in this section are population weighted estimates using two years of data from the Queensland population health survey (QPHS). The latest years of information for each indicator may vary.
Figures on this page are interactive
To learn more about how to navigate interactive figures, dashboards, and visualisations see About this Report.
References
- Queensland Health. 2024. Queensland preventive health survey, https://www.health.qld.gov.au/research-reports/population-health/preventive-health-surveys/about, accessed 7 November 2024.