At a glance
- In 2024, 2.09 million (55.5%) Queensland adults were sufficiently active, while 505,000 (13.4%) Queensland adults were inactive. There were 448,000 (50.0%) Queensland children who were active for at least an hour every day in the past week.
- In 2024, adults living in the most advantaged areas were 40.3% more likely than adults living in the most disadvantaged areas to be sufficiently active. In 2024, adults living in major cities were 16.0% more likely to be sufficiently active than adults living in inner regional areas.
- While the proportion of all Queensland adults meeting physical activity guidelines was stable from 2008 to 2024, there was disparity with the most advantaged areas improving but the most disadvantaged areas worsening. The proportion of Queensland children meeting physical activity guidelines increased by 21.2% from 2011 to 2024.
Introduction
Physical activity (PA) is any bodily movement using large muscle groups that is produced by expending energy. It can be incidental PA, such as doing housework or walking as part of a commute, or intentional PA, such as running or cycling for exercise or sport. Regular physical activity has many benefits that include preventing and treating chronic conditions, such as heart disease, stroke, diabetes, and breast and colon cancer. Regular physical activity also helps prevent other risk factors from developing such as hypertension, and overweight and obesity, as well as improving mental health and wellbeing.1 Serious chronic health impacts of physical inactivity include coronary heart disease, dementia, type 2 diabetes, and some cancers.2 Sitting or lying down too long can also have negative effects on cardiovascular health, independent of physical activity levels.3,4
Physical inactivity contributes significantly to morbidity and mortality for several health conditions, and to health care expenditure:
- In 2024, physical inactivity accounted for 2.1% of the total burden of disease (DALY).
- Considered individually, the highest proportions of disease-specific burden attributable to physical inactivity were for type 2 diabetes mellitus (19.0% of type 2 diabetes mellitus burden) followed by uterine cancer (14.9%) and coronary heart disease (14.0%).5 Results for all the conditions linked to physical inactivity are available in the Burden of Disease section of this report.
- Physical inactivity was estimated to cost the Australian healthcare system between $681 million and $850 million per year (in 2016–17 dollars), while the annual costs from productivity losses due to physical inactivity ranged from $0.18 billion to $15.6 billion.6
The 10,000 Steps program is a free online program that raises awareness and increases participation in physical activity as part of everyday living for individuals, workplaces and communities with challenges and walkway signage.
Latest results
Adults
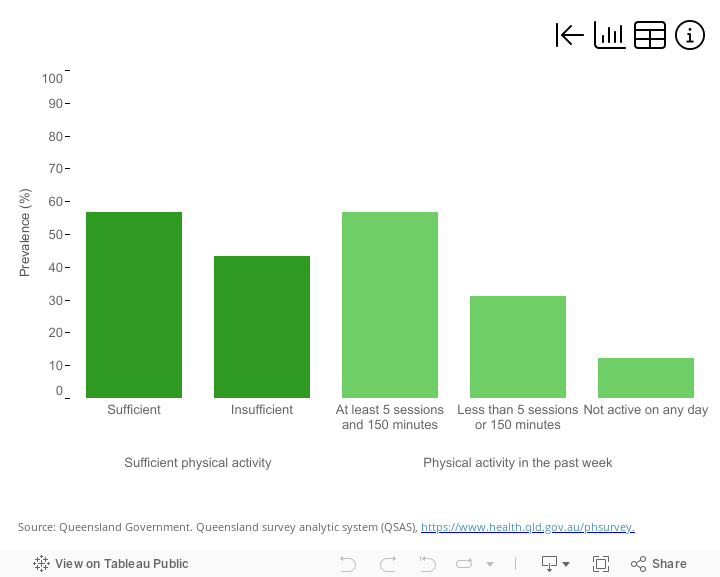
In 2024, more than half of Queensland adults (55.5%) were sufficiently physically active, defined as at least 150 minutes of moderate intensity PA over five or more sessions weekly.
Comparing adult Queenslanders across different sociodemographic groups showed sufficient physical activity was:
- 13.1% more likely among males than females (59.0% for males and 52.1% for females)
- 34.3% more likely among adults 18 to 29 years than adults to 65 years or older
- 40.3% more likely among adults living in the most advantaged areas compared to adults living in the most disadvantaged areas
- 16.0% more likely among adults living in major cities than adults living in inner regional areas.7
Figure 1: Physical activity levels of Queensland adults, 2023
If dashboard does not load, view the dashboard in Tableau.
Children and young people
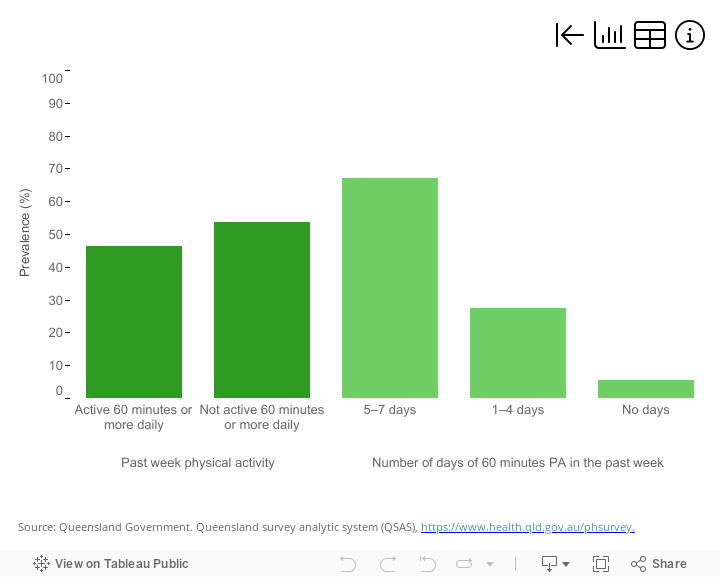
In 2024, half (50.0%) of Queensland children 5 to 17 years were physically active for at least one hour every day as recommended.
Comparing Queensland children across different sociodemographic groups showed sufficient physical activity was:
- 29.5% more likely among boys than girls (56.2% for boys and 43.4% for girls)
- 71.9% more likely among children 5 to 11 years than children 12 to 17 years.
The proportions of sufficiently active children were similar across socioeconomic groups and remoteness areas.7
Figure 2: Physical activity levels of Queensland children, 2024
If dashboard does not load, view the dashboard in Tableau.
Trends
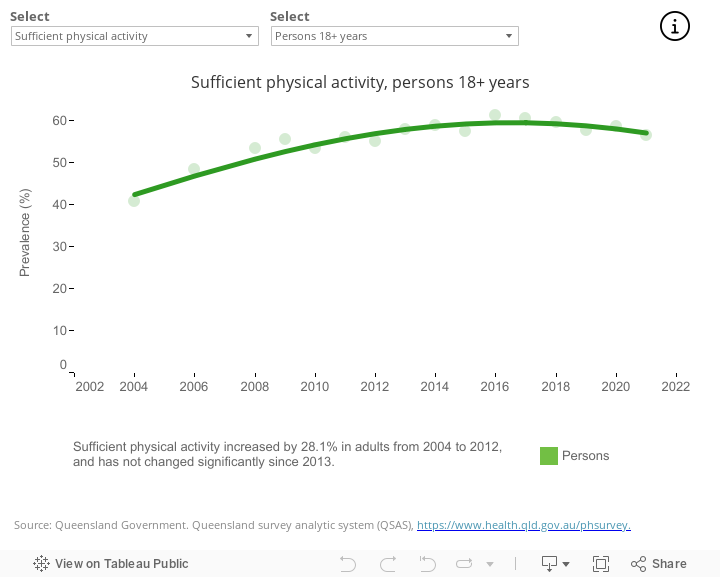
For about the past 15 years, the proportion of Queensland adults meeting the physical activity guidelines was stable (Figure 3). This was evident across sex and age groups, and remoteness areas, however, trends differed by socioeconomic group. From 2008 to 2024, the proportion of Queensland adults meeting the guidelines:
- increased by 12.0% in the most advantaged group
- decreased by 11.9% in the most disadvantaged group.
The proportion of Queensland children meeting the guidelines for physical activity increased by 21.2% from 2011 to 2024. These increases were similar across sex, age and socioeconomic groups but differed by remoteness with increases in major cities (22.3% increase), inner regional (29.5% increase) and outer regional (28.0% increase) areas compared with no change in remote and very remote areas.7
Figure 3: Trends in levels of physical activity in Queensland
If dashboard does not load, view the dashboard in Tableau.
National comparisons
The National Health Survey (NHS), conducted by the Australian Bureau of Statistics, provides national information on a range of health conditions and services including modifiable risk factors. National studies are used to understand how Queensland compares to other Australian jurisdictions. Physical activity is more sensitive to methodological differences than other risk factors and differences, such as collecting physical activity across multiple settings in the NHS, may mean that NHS and Queensland preventive health survey results may differ more than other risk factors.
In 2022, 69.6% of Queensland adults engaged in sufficient physical activity as specified in the 2004 guidelines. The Queensland proportion was similar to the national proportion (71.6%) and Queensland was ranked 2nd among the states and territories. Nationally, a slightly decreasing trend in non-occupational physical inactivity was reported from 2007–08 to 2017–18 with a larger decrease in 2022.8
When strength and toning are included, 23.5% of adult Queenslanders met the 2014 guidelines for physical activity. The Queensland proportion was similar to the national prevalence of 23.6% and Queensland ranked 4th among the states and territories.9
Additional information
Data and statistics
Summary results from the Queensland preventive health survey (QPHS) for Our regions can be found within this report and more detailed and historical results can be accessed at Preventive health surveys.
Strategies and information
For physical activity guidelines and strategies see:
- The Department of Health and Aged Care Physical activity and exercise guidelines for all Australians
- Cancer Council Queensland Physical activity.
Section technical notes
Counts of people by modifiable risk factors are estimated by applying the indicator prevalence to the relevant estimated resident population (ERP). More information about ERP is available from the Australian Bureau of Statistics
- National, state and territory population.
- Data on government and non-government students, staff and schools.
Where presented, ratios were calculated using higher precision estimates than in text. Ratios calculated using estimates in text may differ.
Data for this section were sourced from:
- the Queensland preventive health survey (QPHS) (See Preventive health surveys for further information)
- the Australian Bureau of Statistics National Health Survey (NHS) (See National Health Survey for further information).
At the time of publication, national comparisons more recent than 2017–18 were not available for some indicators of sufficient physical activity. Further details can be found at National Health Survey 2020–21: First Results methodology and National Health Survey: Latest release.
This section includes multiple indicators including those based on the Australian Physical Activity and Sedentary Behaviour Guidelines for Adults (18–64 years).7 Several sources of information are used, with differences in how physical activity is collected and defined. In the NHS, sufficient activity is reported based on total minutes of activity while the Queensland preventive health survey uses both minutes (at least 150 minutes of moderate intensity physical activity weekly) and sessions (five or more weekly).
For children, more holistic 24-hour movement guidelines based on physical activity, low levels of sedentary behaviour and sufficient sleep were released in 2019.7,8 Currently, there is no consensus on the best way to report against these guidelines in general health surveys; therefore, this section measures children’s physical activity as achieving at least one hour of physical activity daily.
Figures on this page are interactive
To learn more about how to navigate interactive figures, dashboards, and visualisations see About this Report.
References
- World Health Organization. 2018. Global action plan on physical activity 2018–2030: more active people for a healthier world, WHO, Geneva, Switzerland.
- Australian Institute of Health and Welfare. 2017. Impact of physical inactivity as a risk factor for chronic conditions: Australian Burden of Disease, https://www.aihw.gov.au/reports/burden-of-disease/impact-of-physical-inactivity-chronic-conditions/summary , accessed 17 January 2025.
- Dunstan DW, Dogra S, Carter SE, et al. 2021. Sit less and move more for cardiovascular health: emerging insights and opportunities, Nature Reviews Cardiology, 18(9):637–648, doi:10.1038/s41569-021-00547-y.
- Jingjie W, Yang L, Jing Y, et al. 2022. Sedentary time and its association with risk of cardiovascular diseases in adults: an updated systematic review and meta-analysis of observational studies, BMC Public Health, 22(1):286, doi:10.1186/s12889-022-12728-6.
- Australian Institute of Health and Welfare. 2024. Australian Burden of Disease Study 2024, https://www.aihw.gov.au/reports/burden-of-disease/australian-burden-of-disease-study-2024/contents/about, accessed 12 December 2024.
- Crosland P, Ananthapavan J, Davison J, et al. 2019. The economic cost of preventable disease in Australia: a systematic review of estimates and methods, Australian and New Zealand Journal of Public Health, 43(5):484–495, doi:10.1111/1753-6405.12925.
- Queensland Health. 2024. Queensland preventive health survey, https://www.health.qld.gov.au/research-reports/population-health/preventive-health-surveys/about, accessed 30 November 2024.
- Australian Institute of Health and Welfare. 2024. Physical activity, https://www.aihw.gov.au/reports/physical-activity/physical-activity#changed-over-time, accessed 13 March 2025.
- Australian Bureau of Statistics. 2023. National Health Survey (NHS) 2022, https://www.abs.gov.au/statistics/health/health-conditions-and-risks/national-health-survey/latest-release, accessed 14 November 2024.
- Department of Health. 2021. Physical activity and exercise guidelines for all Australians, https://www.health.gov.au/topics/physical-activity-and-exercise/physical-activity-and-exercise-guidelines-for-all-australians, accessed 30 November 2024.
- Okely AD, Ghersi D, Hesketh KD, et al. 2017. A collaborative approach to adopting/adapting guidelines-the Australian 24-hour movement guidelines for the early years (birth to 5 years): an integration of physical activity, sedentary behavior, and sleep, BMC Public Health, 17(5):869.