Introduction
Queensland’s population is dispersed over a large area with a larger percentage of its population living outside the greater capital city area than most Australian states and territories.1 Despite this geographic dispersion, in 2021 almost three-quarters of Queensland’s population lived in the south east of the state.2,3
The number and type of health conditions is strongly associated with age at an individual and population level. Understanding an area’s age distribution provides valuable information about the types of health services needed now and into the future.
In addition to informing anticipated health needs and risk factor behaviours, population distributions also influence other characteristics in an area such as economic growth, patterns of work and retirement, the way in which families function, and the ability of governments and communities to provide adequate resources.4
Queensland population changes
The population of Queensland has steadily increased over the past two decades. From 2010 to 2022 the number of Queenslanders increased by 20.8% from 4.40 million to 5.32 million. Population changes from 2010 to 2022 differed by age with the number of children 0 to 14 years increasing by 13.2%, while for adults 65 years or older, the number increased by 61.0%.
Over the next two decades, the Queensland population is expected to grow to 7.30 million (by 2046), an increase of 37.2%. With this growth, Queensland’s population will age, in line with the rest of Australia and other comparable countries.5,6 From 2022 to 2046 the Queensland population 65 years or more will increase by 76.7%, compared to the expected increase of 20.7% in the 0 to 14 years population.
Figure 1: Queensland population by HHS, age and sex
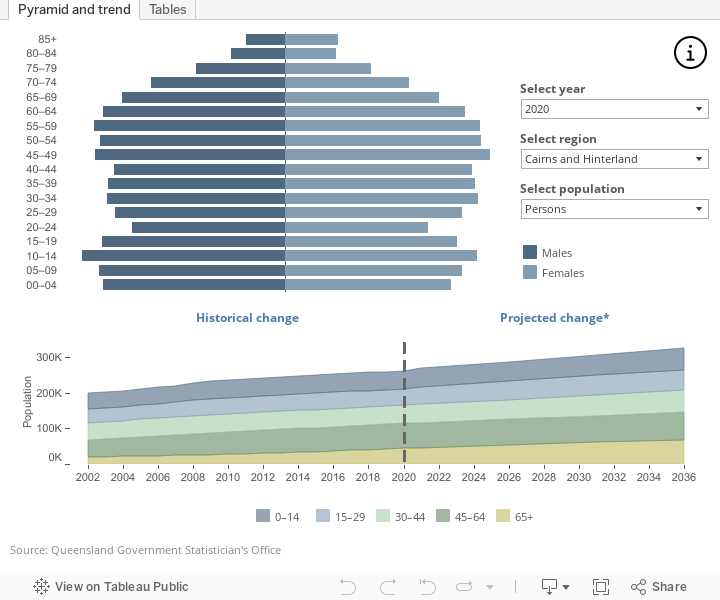
If dashboard does not load, view the dashboard in Tableau.
Regional population changes
Comparing age distributions across Hospital and Health Services (HHSs) showed (Figures 1 and 2):
- The largest proportions of children 0 to 14 years were 26.7% in Torres and Cape HHS, 23.0% in North West HHS and 22.2% in West Moreton HHS
- The largest proportions of adults 65 years or more were 28.0% in Wide Bay HHS, 22.7% in Sunshine Coast HHS and 20.8% in Darling Downs HHS.
Past and future population changes also differed geographically across Queensland. Comparing historical population changes from 2010 to 2022:
- The largest historical increases in populations were in South East Queensland (37.1% in West Moreton HHS, 30.0% in Sunshine Coast HHS and 27.7% in Gold Coast HHS)
- The largest population declines were in western Queensland (13.1% in Central West HHS, 8.3% in North West HHS and 7.6% in South West HHS)
- The largest increases in the population of adults 65 years and older were 75.0% in Cairns and Hinterland HHS, 71.1% in Torres and Cape HHS and 69.7% in Sunshine Coast HHS, noting that all but three HHSs saw increases of over 50%.
South East Queensland is expected to experience the greatest population growth to 2046, with projected increases of 95.7% in West Moreton HHS, 51.0% in Gold Coast HHS and 43.6% in Sunshine Coast HHS. Conversely, population declines by 2046 are expected in more remote regions of Queensland with projected decreases of 20.5% in Central West HHS and 16.4% in South West HHS.
Potential impacts of these population changes are explored in this report’s feature article Ageing and future healthcare demand.
Figure 2: Population characteristics of Queensland regions, 2022
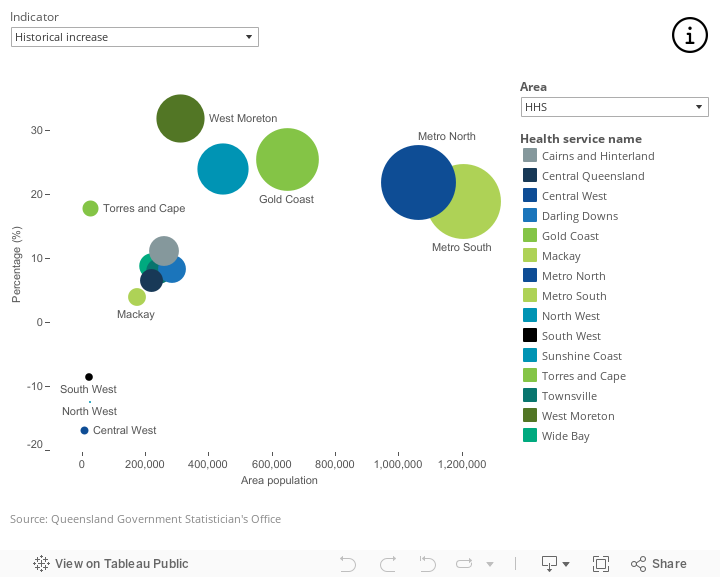
If dashboard does not load, view the dashboard in Tableau.
Additional information
Strategies and information
The Queensland Government Statistician’s Office publishes regional profiles for Queensland. See Queensland Regional Profiles for further information.
Section technical notes
Data in this section were sourced from the Queensland Government Statistician’s Office with some additional processing by the Queensland Department of Health. See Statistics | Queensland Government Statistician’s Office, Queensland Treasury (qgso.qld.gov.au) and Statistical Services Branch for further information.
Population data on this page is based on estimated resident populations (ERPs) provided by the Australian Bureau of Statistics (ABS). The 2021 ERPs are based on adjusted 2021 Australian Census counts, updated with estimates of births, deaths and migration. The 2020 ERPs were processed by QGSO and Queensland Health to provide historical estimates and projections of regional Queensland populations. See Aussies count – working out the official population figures and National, state and territory population methodology for further information.
Figures on this page are interactive
To learn more about how to navigate interactive figures, dashboards, and visualisations see About this Report.
References
- Queensland Government Statistician’s Office. 2022. Queensland compared with other jurisdictions, Census 2021, Queensland Treasury, Brisbane, https://www.qgso.qld.gov.au/statistics/theme/census/census-2021, accessed 3 March 2023.
- Council of Mayors (SEQ). 2023. Annual Report - 2021/22, Brisbane, https://seqmayors.qld.gov.au/documents/ptKXDTsW46IDITFNJWFy.
- Queensland Government Statistician’s Office. 2023. Population estimates - Regions, https://www.qgso.qld.gov.au/statistics/theme/population/population-estimates/regions, accessed 3 March 2023.
- Australian Treasury. 2021. 2021 Intergenerational report: Australia over the next 40 years, The Treasury, Canberra, www.treasury.gov.au/publication/2021-intergenerational-report, accessed 14 October 2022.
- Australian Bureau of Statistics. 2018. Population aged over 85 to double in the next 25 years, https://www.abs.gov.au/articles/population-aged-over-85-double-next-25-years#cite-window1, accessed 20 February 2025.
- United Nations. 2024. World Population Prospects 2024: Summary of Results, United Nations, New York, https://desapublications.un.org/publications/world-population-prospects-2024-summary-results, accessed 20 February 2025.