At a glance
- Lung cancer incidence in females continues to increase and, if current trends continue, could approach male incidence within the next decade. This is driven by the high uptake of smoking in females in the 1970s.
- Population screening programs contributed to declines for some cancers. Cervical cancer decreased 59.0% from 1982 to 2007 then stabilised, while colorectal cancer incidence has decreased 35.5% from 2006 to 2022 in those 50 years and older.
- Early onset of some cancers is a global phenomenon, including in Queensland. While rates are low, evidence suggests rates are increasing in younger age groups for pancreatic and colorectal cancers.
- Five-year cancer survival is improving. For the periods 1991–1995 to 2016–2020, five-year survival for all cancers combined increased from 46.9% to 63.7%—a 35.8% increase. Breast cancer improved by 19.2% and prostate cancer improved by 63.6%.
Introduction
Nationally and in Queensland, the total number of cancers diagnosed annually continues to rise due to the key drivers of increasing population size and ageing of the population. The Australian Institute of Health and Welfare (AIHW) estimated that 86% of the estimated cancer incidence increase from 2000 to 2024 was attributable to these two factors.1
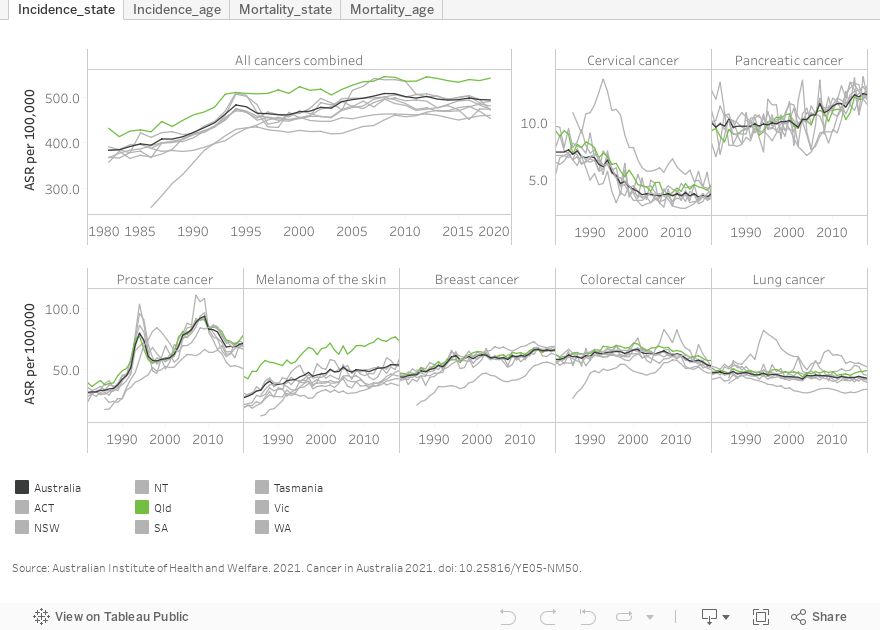
Age standardised rates (ASR or standardised rates) show that Queensland cancer incidence has been higher than Australian incidence for three decades (See Figure S1 in Additional information). In 2020, the standardised incidence rate for all cancers was 12.7% higher in Queensland (542.2 per 100,000 in Queensland and 481.1 per 100,000 persons for Australia).1 A main driver of this difference is higher melanoma rates in Queensland. Melanoma is strongly associated with ultraviolet (UV) light and high to extreme UV exposure can cause skin damage after only 10 minutes of exposure. The Queensland midday UV index is 3 or above year-round.
This section focuses on cancer trends from 1982 to 2022. High level trends, reported as the average annual percentage change (APC) in figures and translated to aggregate changes over the specified time period in text, are presented. When reporting in this manner, it is important to consider that small APCs over long periods will result in large total change over time. Furthermore, for rates that are low, a large change over time may not translate to a high number of additional cases. Caution should be used when interpreting trends with these characteristics.
It is acknowledged that these results may differ from more detailed trend analyses that include factors explaining variability or use methods showing more changes in rates over time. In this report, the intent is to demonstrate differences in trends across health conditions using a consistent approach. National trends, when included, are used to support Queensland findings as national data have less variability over time.
To control for the ageing of the population, age-standardised rates were used in trend analysis overall, and by sex and broad age ranges. Age-specific rates were used in selected analyses by age as specified in the text. Analysis by age broadly shows differences by age cohorts and includes subpopulations targeted by population screening programs. It is important to remember that improvements in early detection, mortality and survival be attributed to the long and sustained investment in cancer research, treatment, and prevention. Population screening programs play an important role, however, designing effective programs is complex and includes important considerations beyond the trends by age presented below. For further trend analysis details, please refer to About this Report and to learn more about population screening programs see the Population Screening sections of this report.
Specific age groups were investigated for some cancers, for example, a recent and emerging global trend has been increasing incidence of some cancers in younger cohorts.2,3,4,5 Of the cancers covered in this report, colorectal and pancreatic cancer have demonstrated this increase in younger age groups (see Figure 4B & 5B). For melanoma, a cohort was defined that would have been exposed to increased health promotion activities to reduce UV exposure.
All cancers
Overall standardised incidence rates for all cancers increased 24.9% from 1982 to 1996 and then the rate of change slowed to an increase of 8.1% from 1996 to 2022 (Figure 1). While males had higher cancer incidence rates, males and females followed a broadly similar trend over time.
Prior to the mid 1990’s, overall standardised mortality rates increased 8.1% from 1982 to 1995 and then decreased 25.8% from 1995 to 2022. Males showed a larger decline and decreased 32.6% from 1994 to 2022, while female rates decreased 20.9% from 1996 to 2022.
Results by age
In those less than 50 years, standardised cancer incidence increased 17.3% from 1982 to 2022 and males and females had similar increases over time. Females, however, had higher cancer incidence rates due, in part, to higher rates of melanoma, and gynaecological cancers, some of which have earlier onset ages.
In those 50 years and older, standardised incidence increased 30.1% from 1982 to 1996 and then slowed to an increase of 8.1% from 1996 to 2022. While males had higher rates, the trends for males and females were broadly similar.
Standardised mortality rates in those less than 50 years decreased 49.6% from 1982 to 2022. In those 50 years and older, mortality rates increased 12.4% from 1982 to 1995 then decreased 23.8% from 1995 to 2022. While males and females 50 years and older showed a similar increase to 1995, males showed a more rapid decrease of 29.8% from 1995 to 2022, while female mortality rates decreased 19.5% over the same period.
Figure 1: Queensland cancer incidence and mortality trends
Lung cancer
A 2011 report estimated that 90% of lung cancer cases in Australian men and 65% of lung cancer cases in Australian women are a result of tobacco smoking.6 There is typically a long lag period between commencement of smoking and lung cancer diagnosis. Smoking prevalence has historically been quite different in males and females with smoking prevalence peaking in males in 1945 or earlier but for females smoking peaked in the mid-1970s.7 This has resulted in stark sex differences in lung cancer incidence and mortality. These differences in male and female lung cancer incidence and mortality have been observed nationally8 and internationally.9
Overall, lung cancer standardised incidence rates were stable from 1982 to 2022 while standardised mortality rates were stable from 1982 to 2008 then decreased 22.5% from 2008 to 2022 (Figure 2A).
For Queensland males, standardised lung cancer (Figure 2A):
- incidence decreased 35.8% from 1982 to 2022
- mortality decreased 30.4% from 1982 to 2012 then decreased 29.2% from 2012 to 2022.
For Queensland females, standardised lung cancer:
- incidence increased 148.3% from 1982 to 2022
- mortality increased 97.4% from 1982 to 2005 then stabilised.
The AIHW reported that lung cancer mortality is expected to increase from 15% of all female cancer deaths in 2000 to 17% in 2024. In males it is expected to decrease from 22% to 17% of cancer deaths over the same period.8
Results by age
Standardised lung cancer incidence rates from 1982 to 2022 in (Figures 2B, 2C, 2D) :
- males less than 50 years, decreased 58.9%
- females less than 50 years were stable
- males 50 to 74 years decreased 51.6%
- females 50 to 74 years increased 104.1%
- males 75 years and older were stable
- females 75 years and older increased 4.6 times.
Standardised lung cancer mortality rates in:
- males less than 50 years, decreased 65.1% from 1982 to 2022
- females less than 50 years decreased 27.5% from 1982 to 2022
- males 50 to 74 years decreased 19.9% from 1982 to 1999 and then decreased 50.4% from 1999 to 2022
- females 50 to 74 years increased 72.3% from 1982 to 2007 and then decreased 20.3% from 2007 to 2022
- males 75 years and older were stable from 1982 to 2011 then decreased 23.4% from 2011 to 2022
- females 75 years and older years increased 192.5% from 1982 to 2004 and then increased 30.7% from 2004 to 2022.
Figure 2: Queensland lung cancer incidence and mortality trends
Melanoma
Encouragingly, melanoma rates in younger age groups have been falling in Queensland and Australia since the late 1990’s (See Figure 5B) consistent with published research. 10, 11–13 Research indicates that these decreases are partly attributed to social and behavioural changes including uptake of sun safe behaviour.14 Because COVID-19 disrupted health care services including skin cancer checks, trend analysis was only conducted to 2019 for incidence.
In Queensland, standardised melanoma incidence rates increased 61.3% from 1982 to 2019. Over this period males and females saw different rates of change with male rates increasing 79.9% while female rates increased 39.3%.
After increasing 44.7% over three decades, standardised mortality rates peaked in 2013 and then decreased 34.5% with similar reductions in males and females (Figure 3A). Reduced mortality has been attributed, in part, to earlier detection which has also resulted in an increasing proportions of non-invasive melanoma diagnoses15 and improved morbidity. Improvements due to treatment advances using novel immunotherapies are likely to also be contributing to this decrease.16
Results by age
For Queensland adults 20 to 39 years, standardised rates increased 12.7% from 1982 to 1997 and then decreased 26.7% from 1997 to 2019.
For Australian adults 20 to 39 years, age-specific rates increased 21.4% from 1982 to 1997 and then decreased 40.1% from 1997 to 2019. In contrast to all other age groups reported, melanoma incidence is higher in 20 to 39 year old females than males in Queensland and Australia (data not shown). Mortality rates are too low to report for the 20 to 39 age group.
AIHW reported similar age cohort differences using a different methodology. From 2000 to 2024, AIHW reported that melanoma decreased by 7.8 cases per 100,000 adults 30 to 39 years but increased by 1.7 cases per 100,000 adults 40 to 49 years.8
Age cohort differences were evident in older age groups in Queensland showing that age-specific melanoma (Figure 3C and 3D).
- incidence rates in 40 to 64 year olds increased 49.9% from 1982 to 2019
- incidence rates in adults 65 years and older increased 66.3% from 1982 to 1996 and then slowed to an increase of 57.7% from 1996 to 2019
- mortality rates in adults 65 years and older, increased 2.1 times from 1982 to 2010 and then decreased 26.2% from 2010 to 2022.
Figure 3: Queensland melanoma incidence and mortality trends
Pancreatic cancer
While pancreatic cancer is relatively rare, it has high mortality. As observed globally,17 incidence and mortality rates for pancreatic cancer in Queensland are increasing.
From 1982 to 2022, standardised pancreatic cancer (Figure 4A):
- incidence rates increased 43.1%
- mortality rates increased 27.0%.
Rates of increase were higher in people under 50 years than in those over 50 years. For the following results, Australian data, which have a larger number of cases, are used to support the Queensland under 50 years findings and the number of years for analysis were aligned. Due to small case numbers, trends in Queensland mortality rates are not provided for adults under 50 years.
From 1986 to 2020, Queensland pancreatic cancer (Figure 4B and 4C):
- age-specific incidence increased 102.7% in for those under 50 years
- standardised incidence increased 35.6% for those 50 years and older
- standardised mortality increased 25.5% for those 50 years and older.
From 2000 to 2024, AIHW reported an increase of 1 case of pancreatic cancer per 100,000 in adults 30 to 39 years and 2 cases per 100,000 in adults 40 to 49 years.8
It should be noted that in young cohorts incidence rates are low so although annual percentage increases are high this does not translate to a large number of additional cancers in these age groups.
Figure 4: Queensland pancreatic cancer trends
Colorectal cancer
Bowel cancer screening is one of the few screening programs that is based on identifying pre-cancerous cells. A population-level bowel screening program was introduced nationally in 2006.18 Initially, adults 55 and 65 years were eligible, expanding to free 2-yearly testing for those 50 to 74 years in 2014, and to 45 to 74 years from 1 July 2024. Prior to and during the roll out of the bowel cancer screening program there was an independent and significant increase in the number of colonoscopy procedures administered in Australia, which also contributed to changes in incidence and mortality rates.19 To learn more about colorectal cancer population screening programs see the Population Screening sections of this report.
In Queensland, standardised colorectal cancer incidence rates overall increased 15.4% from 1982 to 2006, around the time of the introduction of the screening program. After the introduction of screening, incidence rates decreased 26.4% from 2006 to 2022. AIHW reported that national trends peaked in 2001, followed by an estimated 33% decrease in standardised incidence rates from 2001 to 2024, with the most significant decreases coinciding with the introduction of the national screening program.20
Standardised incidence rates have been consistently higher in males with male rates increasing faster than female rates in the pre-screening period (rates increased 27.8% from 1982 to 2001 in males). Following the introduction of screening, male and female rates declined at similar rates.
Queensland standardised mortality rates for colorectal cancer overall were stable from 1982 until the late 1990s, then decreased 39.7% from 1997 to 2022 (Figure 5A). Males and female showed broadly similar rates of change from about the mid-1990s.
Results by age
Early onset colorectal cancer, defined as colorectal cancer in people under 50, has risen sharply in recent decades. While research has identified some environmental risk factors, a global research effort is under way to understand the underlying causes of this emerging disease.2,3,4,5
In Queensland, a period of decreasing incidence in adults 20 to 39 years reversed in the mid 1990’s with similar findings for males and females (Figure 5B). Age-specific colorectal cancer incidence rates in Queensland decreased 15.6% from 1982 to 1996 then increased 206.3% from 1996 to 2022. Due to small numbers, trends in mortality are not provided for this age group.
From 2000 to 2024, AIHW reported national increases in colorectal cancer incidence rates from 6.3 to 17.2 per 100,000 in adults 30 to 39 years and 24.9 to 29.9 per 100,000 in adults 40 to 49 years.8
In those under 50 years, Queensland standardised colorectal cancer (Figure 5C):
- incidence rates decreased 25.1% from 1982 to 1995 and then increased 75.3% from 1995 to 2022
- mortality rates decreased 45.3% from 1982 to 1994 and have been stable from 1994 with similar findings for males and females (data not shown).
In those 50 years and older, Queensland standardised colorectal cancer (Figure 5D):
- incidence rates increased 18.2% from 1982 to 2006 then decreased 35.5% from 2006 to 2022
- mortality rates were stable until 1997 then decreased 41.2% from 1997 to 2022 with similar rates of change for males and females in recent years.
Figure 5: Queensland colorectal cancer incidence and mortality trends
Breast cancer
There was a 44.8% increase in standardised rates of female breast cancer from 1982 to 1999, followed by a stable trend from 1999 to 2022 (Figure 6A). For mortality, standardised rates were stable from 1982 to 1993 then decreased 40.9% from 1993 to 2022. To learn more about breast cancer population screening programs see the Population Screening sections of this report.
Results by age
In females less than 50 years, standardised breast cancer (Figure 6B):
- incidence rates increased 32.2% from 1982 to 2022
- mortality rates decreased 58.9% from 1982 to 2022.
In females 50 years and older, standardised breast cancer (Figure 6C):
- incidence rates increased 52.2% from 1982 to 1999 then stabilised
- mortality rates were stable until 1993 then decreased 37.4% from 1993 to 2022.
Figure 6: Queensland female breast cancer incidence and mortality trends
Cervical cancer
Cervical cancer is another example where screening can identify pre-cancerous cells with population screening programs introduced in 1991. A second major advance in prevention was determining that a primary cause is the infectious pathogen human papillomavirus (HPV). HPV vaccination programs for school age girls were introduced in Australia in 2007 and for school age boys in 2013. To learn more about cervical cancer population screening programs see the Population Screening sections of this report.
Standardised cervical cancer incidence rates decreased 59.0% from 1982 to 2007 then stabilised (Figure 7). In Queensland, standardised rates of cervical cancer mortality decreased 65.1% from 1982 to 2022.
Figure 7: Queensland and Australian cervical cancer incidence and mortality trends
Prostate cancer
Early detection and management of prostate cancer is a complex issue. The prostate-specific antigen (PSA) test became available in the early 1990s. PSA screening guidelines were established in 2014 by the Prostate Cancer Foundation of Australia and the Cancer Council of Australia. Evidence about the efficacy of PSA testing continues to evolve as new diagnostic tests are developed.21,22 Men are encouraged to speak to their doctor for the latest advice.
Due to clinical and diagnostic changes over the analysis period, only high level trends are reportable for prostate cancer.
In males, standardised prostate cancer (Figure 8):
- incidence rates increased 75.5% from 1982 to 1994 and then increased 28.5% from 1994 to 2022
- mortality rates increased 52.3% from 1982 to 1993 and then decreased 44.3% from 1993 to 2022.
Figure 8: Queensland prostate cancer incidence and mortality trends
Cancer survival trends
From 1991 to 2020, national 5-year survival has improved by 35.8% for all cancers (survival was 46.9% for the period 1991–1995 and 63.7% for the period 2016–2020) (Figure 9). Of the cancers included in this report, most showed improvement in 5-year survival over the period. This reflects the cumulative effect of multifaceted and sustained investment in cancer prevention, detection and treatment across a range of cancer types, as well as changes to relative prevalence of cancer types over time.
From 1991–1995 to 2016–2020, 5-year survival for (Figure 9):
- female breast cancer increased 19.1%
- prostate cancer increased 60.1%
- lung cancer increased 142.1%
- pancreatic cancer increased 3.6
- colorectal cancer increased 34.7%.
Figure 9: National trends in 5-year cancer survival
Additional information
Figure S1: Trends in national and jurisdictional cancer incidence and mortality
If dashboard does not load, view the dashboard in Tableau
Data and statistics
Visit Cancer Alliance Queensland (CAQ) to:
- learn more about accessing cancer statistics
- explore the CAQ data dashboards
Visit the Australian Institute of Health and Welfare website for:
- Cancer data in Australia
- Australia’s health cancer
Information and strategies
Visit Queensland Cancer screening for more information about cancer screening services.
Section technical notes
- Prostate and cervical cancers occur only in males and females respectively. Where rates are provided for “persons” for these cancers it is done for comparative purposes.
- 5-year cancer survival was calculated using the Observed method of survival calculation for both Queensland and Australia.
- Comparisons are made of incidence rates for Queensland obtained from the Queensland Cancer Register23 and for Australia obtained from the Australian Institute of Health and Welfare.24 It is acknowledged that there will be minor differences in case numbers due to data collection methods. The maximum error between sources in most recent years was estimated to be +/- 1-2% (for rates).
Figures on this page are interactive
To learn more about how to navigate interactive figures, dashboards, and visualisations see About this Report.
References
- Australian Institute of Health and Welfare. 2024. Cancer data in Australia, https://www.aihw.gov.au/reports/cancer/cancer-data-in-australia, accessed 24 November 2024.
- Hofseth LJ, Hebert JR, Chanda A, et al. 2020. Early-onset colorectal cancer: initial clues and current views, Nature Reviews Gastroenterology & Hepatology, 17(6):352–364, doi:10.1038/s41575-019-0253-4.
- O’Sullivan DE, Sutherland RL, Town S, et al. 2022. Risk Factors for Early-Onset Colorectal Cancer: A Systematic Review and Meta-analysis, Clinical Gastroenterology and Hepatology, 20(6):1229–1240.e5, doi:10.1016/j.cgh.2021.01.037.
- Ugai T, Sasamoto N, Lee H-Y, et al. 2022. Is early-onset cancer an emerging global epidemic? Current evidence and future implications, Nature Reviews Clinical Oncology, 19(10):656–673, doi:10.1038/s41571-022-00672-8.
- Sung H, Siegel RL, Laversanne M, et al. 2025. Colorectal cancer incidence trends in younger versus older adults: an analysis of population-based cancer registry data, The Lancet Oncology, 26(1):51–63, doi:10.1016/S1470-2045(24)00600-4.
- Tobacco | Cancer Australia. n.d., https://www.canceraustralia.gov.au/resources/position-statements/lifestyle-risk-factors-and-primary-prevention-cancer/lifestyle-risk-factors/tobacco#_ENREF_35.
- Tobacco in Australia. 2021. Prevalence of smoking-adults, https://www.tobaccoinaustralia.org.au/chapter-1-prevalence/1-3-prevalence-of-smoking-adults.
- Australian Institute of Health and Welfare. 2024. Cancer data in Australia, https://www.aihw.gov.au/reports/cancer/cancer-data-in-australia, accessed 24 November 2024.
- Schüz J, Espina C and Wild CP. 2019. Primary prevention: a need for concerted action, Molecular Oncology, 13(3):567–578, doi:10.1002/1878-0261.12432.
- Venugopal K, Youlden D, Marvelde LT, et al. 2023. Twenty years of melanoma in Victoria, Queensland, and South Australia (1997 – 2016), Cancer Epidemiology, 83:102321, doi:10.1016/j.canep.2023.102321.
- Whiteman DC, Green AC and Olsen CM. 2016. The Growing Burden of Invasive Melanoma: Projections of Incidence Rates and Numbers of New Cases in Six Susceptible Populations through 2031, Journal of Investigative Dermatology, 136(6):1161–1171, doi:10.1016/j.jid.2016.01.035.
- Wallingford SC, Iannacone MR, Youlden DR, et al. 2015. Comparison of melanoma incidence and trends among youth under 25 years in Australia and England, 1990–2010, International Journal of Cancer, 137(9):2227–2233, doi:10.1002/ijc.29598.
- Iannacone MR, Youlden DR, Baade PD, et al. 2015. Melanoma incidence trends and survival in adolescents and young adults in Queensland, Australia, International Journal of Cancer, 136(3):603–609, doi:10.1002/ijc.28956.
- Whiteman DC, Neale RE, Baade P, et al. 2024. Changes in the incidence of melanoma in Australia, 2006–2021, by age group and ancestry: a modelling study, Medical Journal of Australia, 221(5):251–257, doi:10.5694/mja2.52404.
- Coory M, Baade P, Aitken J, et al. 2006. Trends for in situ and Invasive Melanoma in Queensland, Australia, 1982–2002, Cancer Causes & Control, 17(1):21–27, doi:10.1007/s10552-005-3637-4.
- Wolchok JD, Hodi FS, Weber JS, et al. 2013. Development of ipilimumab: a novel immunotherapeutic approach for the treatment of advanced melanoma, Annals of the New York Academy of Sciences, 1291(1):1–13, doi:10.1111/nyas.12180.
- LaPelusa M, Shen C, Arhin ND, et al. 2022. Trends in the Incidence and Treatment of Early-Onset Pancreatic Cancer, Cancers, 14(2):283, doi:10.3390/cancers14020283.
- National Bowel Cancer Screening Program. n.d., https://www.health.gov.au/our-work/national-bowel-cancer-screening-program/about-the-national-bowel-cancer-screening-program.
- Worthington J, He E, Lew J-B, et al. 2023. Colonoscopies in Australia – how much does the National Bowel Cancer Screening Program contribute to colonoscopy use?, Public Health Research & Practice, 33(1), doi:10.17061/phrp32342216.
- Cancer data in Australia, An overview of colorectal cancer in Australia. n.d. Australian Institute of Health and Welfare, https://www.aihw.gov.au/reports/cancer/cancer-data-in-australia/contents/cancer-data-commentaries/an-overview-of-colorectal-cancer-in-australia?request=smoothstate.
- Prostate Cancer Foundation of Australia and Cancer Council Australia. 2015. PSA testing and early management of test-detected prostate cancer: Clinical practice guidelines, NSW, https://www.pcfa.org.au/media/611412/PSA-Testing-Guidelines-Overview.pdf.
- Rashid P, Zargar‑Shoshtari K and Ranasinghe W. 2023. Prostate-specific antigen testing for prostate cancer: Time to reconsider the approach to screening, Australian Journal of General Practice, 52(3):91–95, doi:10.31128/AJGP-08-22-6509.
- Queensland Health, Brisbane. 2023. Queensland Cancer Register: Cancer Alliance Queensland, https://cancerallianceqld.health.qld.gov.au/, accessed 24 March 2025.
- Australia C. 2022. Cancer in Australia statistics, https://www.canceraustralia.gov.au/research-data/data-and-statistics/cancer-australia-statistics